You open the tracker. DXY Bias Score: +6, Bullish. Then you open the chart, and it is red. The dollar index has slid from about 102.9 on CPI day to about 101.7 this week, its lowest in three weeks. So which one is wrong?
Usually, neither. They measure different things at different speeds. The score tells you which way the bigger move is more likely to go. The daily candle tells you what traders are doing this week. This post shows how we put the two together at SOG Capital, using the dollar right now as the example.
Think of it as a rainy season
In Ghana, the rainy season does not mean it rains every day. You can have a dry, sunny Tuesday in the middle of the season, and nobody says the season is over. The season sets the direction. The day is just the day.
Our macro bias is the season. A daily candle is the weather on one day. A bullish bias does not say the dollar rises every day. It says that, given the data, higher is more likely than lower over the coming weeks. A few dry days are usually a pause, not the end of the season. The season only changes when the forecast changes, and for us the forecast is the data.
What the score is, and what it is not
The DXY Bias Score adds up ten US drivers, each scored from the latest data. It is +6 today. Seven drivers read bullish for the dollar: the September rate hike, the Fed’s higher rate projections, CPI, unemployment (U-6), PPI (counted double), trader positioning and the Gulf tensions. One is neutral: the odds of an October hike, which sit under our 30% line. Two lean the other way: weak jobs and soft wages.
The score is a snapshot of data. It does not see tomorrow’s mood, who has already bought, or what a Fed official will say. That is not a flaw. It is just a different job from the one a candle does.
What the dollar is doing right now
From a low near 98.6 (a double bottom in late August and early September), the dollar index climbed to about 102.9 on October 14, the day of the hot CPI report. That was its highest level in about 18 months, and it was above the highs the index made over the summer. Since then it has slipped to around 101.7, a three-week low.
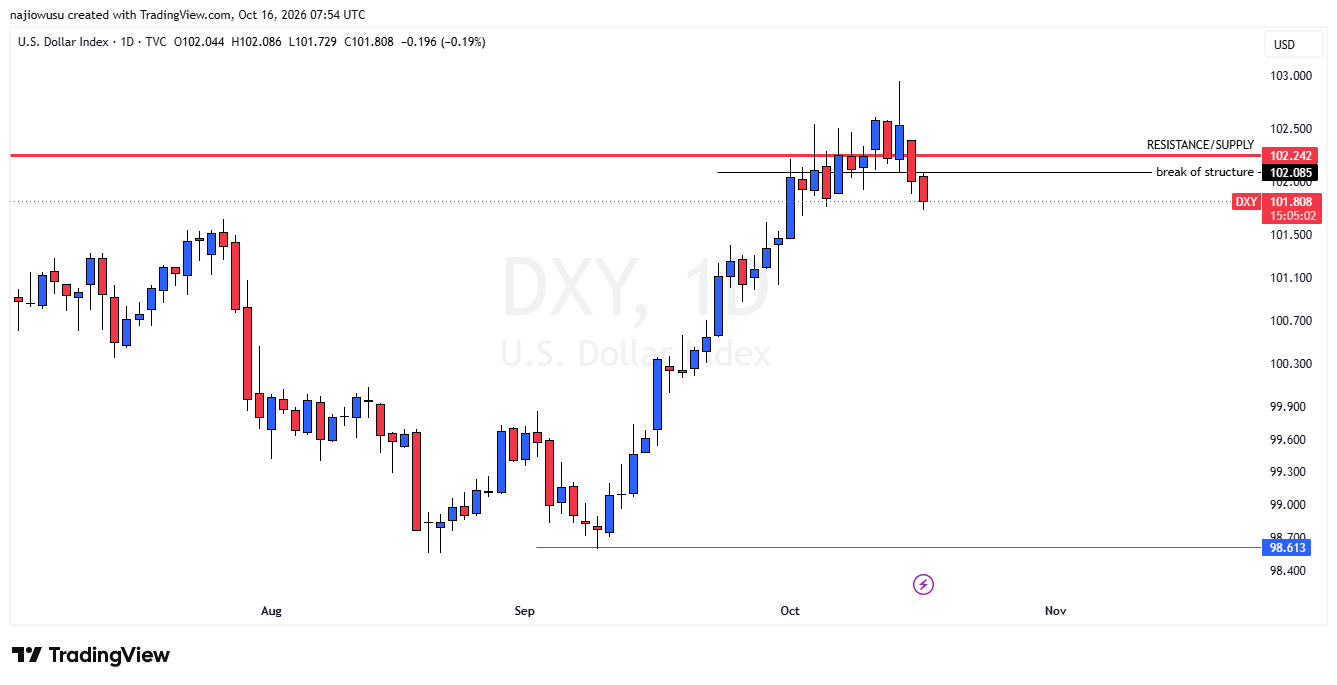
Two things happened along the way. Bets on an October Fed hike faded, and bond yields, which give the dollar its interest-rate edge, eased from their highs. The weekly chart did not break, though. It still shows higher lows and higher highs since September. The dollar is not falling apart. It is catching its breath.
Four reasons price can fall while the bias stays bullish
- Price runs ahead of the news, then gives it back. On CPI day the dollar jumped to an 18-month high, then handed back that gain as hike bets faded and fell to a two-week low by October 16. Traders have an old saying for this: buy the rumour, sell the fact.
- Traders go quiet before a big event. The Fed meets on October 27–28 and is in its quiet period now. One market report this week said investors were cautious about rebuilding bullish dollar positions before the decision. Taking profit and waiting is normal behaviour, and it shows up as a pullback.
- The dollar index is a basket, and a bit more than half of it is the euro. If the euro or the yen firm up for their own reasons, the index can fall even when the dollar is fine against most other things. A report this week blamed exactly that for part of the slide.
- The score cannot see everything. Markets trade expectations. The odds of an October hike, the part our score can see, are low, even though traders still expect a December hike with about 90% odds. That mix can drag the dollar down for a while without changing the bigger picture.
How we line up macro with the charts
This is how we do it at SOG Capital. It is not a rule, and you are free to build your own.
- Start with the macro bias. Bullish or bearish, from the score.
- Look at the charts from the top down, starting with the weekly. Find the highest timeframe whose structure agrees with the bias. That is your anchor. For the dollar, the weekly chart agrees with the bullish bias, so the weekly is the anchor.
- Treat lower timeframes that disagree as pullbacks or retracements. The daily chart is falling, so we read it as a pullback inside the weekly uptrend, not as a new downtrend. We keep reading it that way until the data changes.
- Use the lower timeframes for timing. Wait for the 4-hour or 1-hour chart to turn back in the direction of the bias before acting, instead of guessing where the pullback ends.
- Know what would change your mind before you start. More on that below.
| Timeframe | Its job | The dollar today |
|---|---|---|
| Weekly | The season: sets the direction | Still bullish |
| Daily | The weather: shows pullbacks | Pulling back |
| 4-hour and 1-hour | The clouds: help with timing | Where we would watch for the turn back up |
A worked example: how deep can a pullback go?
The rise from the September low (about 98.6) to the October high (about 102.9) was roughly 4.3 points. A normal pullback often gives back part of a move like that, not all of it. So far the dollar has given back about 1.2 points, around 28% of the rise.
Some traders lay a ruler over the move: giving back 38%, 50% and 62% of the rise would take the index to about 101.3, 100.8 and 100.2. Analysts quoted this week named support at 101.50–101.65 first and then 100.85–101.00, and the lowest price of the past month is about 100.2. These are places where a pullback might pause. They are not predictions.
What would change our mind
- The data changes. The next tests are the Fed on October 28, PCE inflation on October 29 and the jobs report on November 6. The jobs driver is already negative, so a second weak jobs report is the most likely thing to crack the bias. If the score falls well below +6, the bullish case is weakening.
- The structure breaks. A daily close under about 100.2, the low of the past month, would make this a deeper pullback. A weekly close under the September low near 98.6 would break the weekly uptrend. At that point we would stop calling it a pullback.
The mirror image: bearish bias, price pushing up
It works the other way too. Say the score were -5 and the weekly chart were making lower highs and lower lows. Then the dollar bounces for a week or two on the daily chart. Same logic: the weekly is the anchor, and the daily bounce is a retracement, a place to watch for the turn back down, not a reason to throw away the bias. The same two checks apply in reverse: has the data turned, and has the weekly structure broken?
What if no timeframe agrees?
Sometimes the macro says bullish, but even the weekly chart is bearish. Then there is no alignment, and no alignment means no trade. It is the same thinking behind staying out when the dollar index, EURUSD and GBPUSD do not agree, which we went through in our GBPUSD post. That is not the method failing. It is the method telling you to wait.
A quick checklist
- What is the macro bias, and how strong is it?
- Which is the highest timeframe that agrees with it?
- Is the lower timeframe move a pullback inside that structure?
- What exact data or price level would change my mind?
- Is my trade size small enough that I can survive being early?
The risks
- A pullback can turn into a reversal, and nobody can tell in advance. That is why you define your exit before you enter.
- Both the score and the chart can be wrong at the same time.
- Lower timeframes can run a long way against you. Use a stop loss and a small position size.
- Prices differ slightly between brokers and news sources. This post uses news reports and our own charts. It is education, not financial advice.
Where the numbers come from
Dollar index levels and news were taken from reports by Investing.com, Vantage and FXEmpire, and from our own daily chart. The current score and its ten drivers are on the Macro Tracker. To see how the same ideas played out around the CPI and PPI reports, read why hike odds fell after two hot reports and our yields guide. We will go through the Fed decision in the next post.