Two hot inflation reports landed this week. Normally that pushes bond yields and the dollar up, because traders expect the Fed to raise rates. This week the opposite happened: yields fell, the chance of an October hike dropped to 10.5%, and the dollar index slipped under a key level. If that confuses you, you are not alone. Here is what the market is doing, in plain English.
What we expected, and what happened
| High point (about) | Friday | |
|---|---|---|
| Chance of an October hike | 53% on CPI day | 10.5% |
| 2-year yield | 4.96% in late September | 4.715% |
| 10-year yield | 5.35% in early October | 5.081% |
| Dollar index | Spiked toward 103 on CPI day | About 101.8 on Friday morning, under its 102.085 level |
The yield highs are read off the charts below, so treat them as close, not exact.
First, why do yields matter for the dollar?
A bond yield is the interest rate you earn for lending money to the US government. The 2-year yield is mostly a bet on what the Fed will do over the next two years. It rises when traders expect hikes and falls when they expect the Fed to wait. The 10-year yield also reflects the outlook for growth and inflation.
One more thing makes bond charts confusing: yields and bond prices move like a see-saw. When traders buy bonds, the bond’s price goes up and its yield goes down. When they sell bonds, the price goes down and the yield goes up. So “buying bonds” pushes yields lower, not higher.
Higher US yields make it more rewarding to hold dollars, which supports the dollar. When yields fall, that support fades. So the chain this week was: Fed sounds patient, the 2-year yield falls, the dollar loses support, and EURUSD and GBPUSD rise.
Why hot inflation did not push yields up
- Much of it was already priced in. The 2-year yield climbed about 0.85 points, from the August low near 4.10% to nearly 4.96% in late September, before these reports came out. When the news only confirms what traders already expect, many take profits instead. The old saying is “buy the rumour, sell the news.”
- The Fed said there is no rush. Bowman spoke before CPI. Daly and Goolsbee spoke after it, and Warsh said Friday he will not prejudge the meeting. The 2-year yield follows the Fed, not the headline. A falling 2-year yield and hike odds at 10.5% are one message, not two.
- The heat came from energy. Petrol (gasoline) prices drove more than half of the CPI rise, and PPI energy was up 10.8%. Core CPI beat forecasts by only a tenth. Higher fuel prices take money out of households’ pockets, which can slow spending. With jobs at +29,000 and wages up only 0.1%, bond traders are also worried about growth, and weak growth pulls yields down.
- Yields were already high. A 10-year yield above 5% means mortgages, business loans and government borrowing already cost a lot. That works like a brake on the economy, so the Fed has less reason to rush.
- Bond buyers stepped in when yields jumped. Both charts below show yields jump on the inflation news, then fall back. Higher yields mean more interest for the same bond, so traders bought bonds at those levels. Remember the see-saw: buying bonds lifts their price and pushes the yield down. CME pointed to a strong rally in Treasuries on PPI day, and a bond rally means yields falling.
One thing the market is not saying: that the Fed is finished. The 2-year yield at about 4.7% still sits well above the Fed’s 3.75–4.00% range, and markets still price roughly a 90% chance of a hike by December. The message is “probably not October”, not “no more hikes”.
What the yield charts show
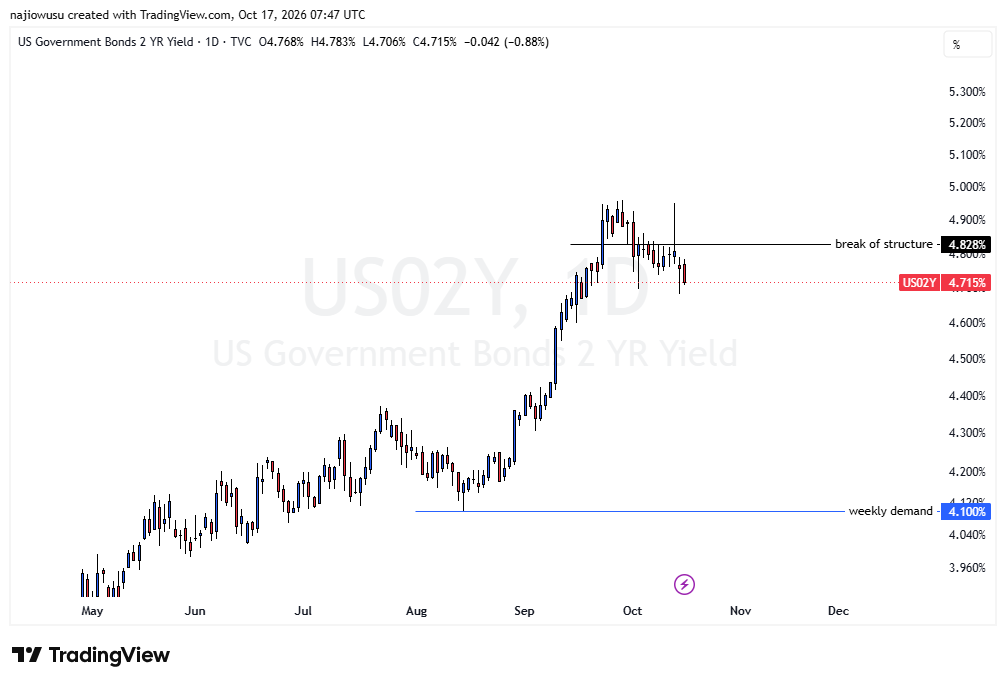
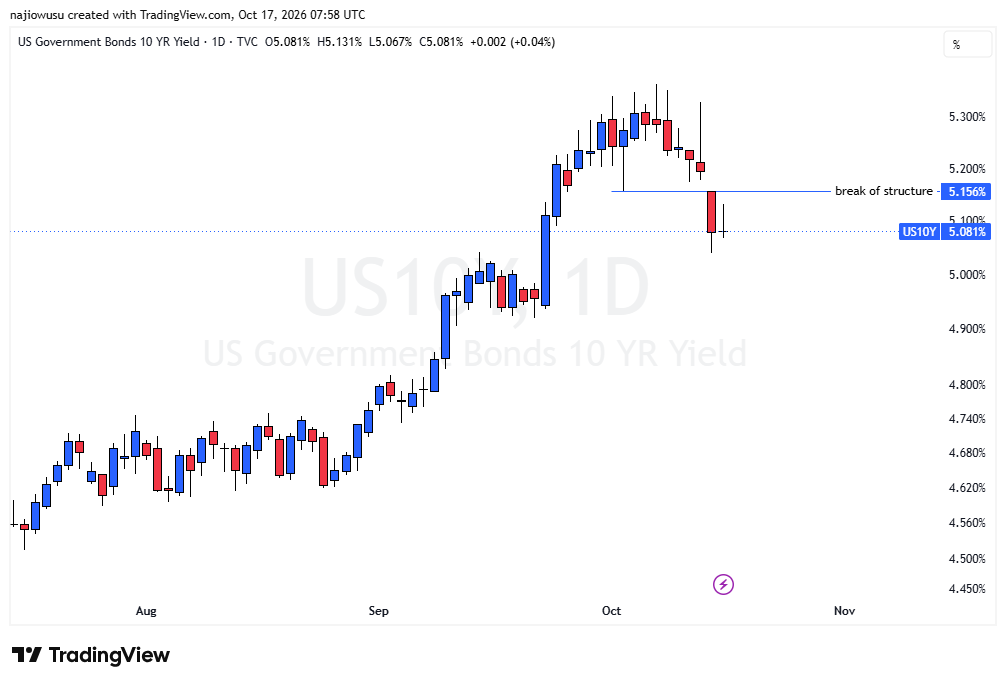
A break of structure is a level where price has broken past a recent swing high or low. When price closes beyond it, the old direction may be pausing or turning. Both yields have now closed under theirs. That is a warning, but one daily break does not prove a top.
Is this a top, or a pause before the FOMC?
We cannot tell yet, and honestly it could be either. Here is what would separate the two.
| Just a pause | Yields have topped | |
|---|---|---|
| 10-year yield | Closes back above 5.156% | Stays under 5.156% and makes lower lows |
| 2-year yield | Closes back above 4.828% | Stays under 4.828% |
| Hike odds | Back above 30% | Stay low |
| Dollar index | Closes back above 102.242 | Stays under 102.085 |
| What could cause it | A hot PCE on October 29, a hawkish FOMC message, or another jump in oil | Soft data, calm oil, and a Fed that keeps sounding patient |
Key dates: the FOMC meeting is October 27–28 (no new projections), PCE is October 29, jobs are November 6, CPI is November 10 and PPI is November 13. Fed officials normally go quiet before a meeting, so expect fewer Fed headlines in the next ten days.
What this means for the DXY Bias Score
The score is still +6, Bullish DXY. Bond yields are not one of its drivers. The score counts released data, hike odds and positioning, while yields and the dollar trade on what the market expects next. That is why the two can disagree for a while. The score will only change when a release or the odds change. Our October 16 post has the full breakdown, with the dollar, EURUSD and GBPUSD levels.
The risks
- Our reasons are our reading of the market. No one can prove a single cause, and the real mix may differ.
- The yield levels were read off our own charts and are approximate. We have only looked at the daily charts, so check the weekly before trading.
- A hot PCE or a hawkish FOMC could push yields and the dollar back up quickly.
- Never risk money you can’t afford to lose. This is education, not financial advice.