Here is the short version. September CPI came in hot. September PPI came in far hotter: the biggest monthly jump since March 2022. We expected the chance of a Fed rate hike at the October 27–28 meeting to keep climbing into the meeting. It did the opposite. After a quick jump on CPI day, the odds fell back, and by Friday CME FedWatch showed just 10.5%, far under the 30% line our score uses. The dollar fell with them. On the daily charts, the dollar index has closed back under a key level, while EURUSD and GBPUSD have pushed up through theirs.
What happened to the hike odds this week
CME FedWatch turns futures prices into a simple number: the chance the Fed raises rates at its next meeting. Here is how that number moved. These figures change all day and different sources read them at different times, so treat each one as a rough range, not an exact print.
| When | Chance of an October hike | What was going on |
|---|---|---|
| Before CPI | About 19–22% | Weak jobs report. New York Fed head John Williams had said one more hike this year would be enough. |
| CPI day, Wed Oct 14 | About 35% at first, then above 50% | Hot CPI. CME said the peak reached 53%. |
| Thu Oct 15 morning | About 32%, down from 54% | Fed officials Michelle Bowman and Mary Daly said there is no need to rush. |
| Thu Oct 15, PPI | About 29–34% | PPI beat forecasts by a mile, yet the odds barely moved and ended the day under 30%. |
| Fri Oct 16 | About 28% early, then 10.5% | Fed Chair Kevin Warsh, speaking at the IMF meetings, said the Fed already tightened a month ago and he will not prejudge future meetings. Goldman Sachs now expects a skip in October and a hike in December. |
So the odds did bump up into the data, as we thought they might. They just did not stay there.
Why hot numbers did not push the odds higher
This is the part that surprises most traders, so let us take it one reason at a time.
- The Fed just hiked, and officials say there is no rush. The Fed raised rates a quarter point to 3.75–4.00% on September 16. Bowman said the Fed has time to watch how markets and the economy react before deciding on more. Daly said another hike will probably be needed, but there is “no urgency to act.” Those two comments were enough to cut the odds sharply in one morning. On Friday Warsh added that the Fed tightened a month ago and he will not prejudge what comes next, and the odds dropped again.
- The question is “when”, not “if”. In September, 16 of the 18 Fed officials who gave forecasts expected at least one more hike this year, and markets still price roughly a 90% chance of one by December. So a hike is expected. The market simply thinks December is more likely than October. Many analysts also expect the Fed to hold in October, which is one week before the US midterm elections. That is their opinion, not a fact, but it is part of why October is priced low.
- Most of the heat came from energy. Petrol (gasoline) prices rose 9.1% in a month, and that was more than half of the CPI rise. In PPI, energy rose 10.8% and gasoline 20.3%. The Fed mostly wants to know whether price rises are spreading to everything else. Core CPI rose 0.3% on the month, only a tenth above forecast. Core PPI was hot, with 5.0% a year, so this is not an all-clear. But the Fed’s preferred inflation gauge, PCE, arrives on October 29, the day after the meeting, so there is a reason to wait for it.
- The job market is cooling. September jobs came in at 29,000 against 84,000 expected, the two months before were revised down by 60,000, and wages rose only 0.1%. Raising rates into a weakening job market is a harder decision. The odds had already slid from about 50% to about 22% in the days after the jobs report.
- The bond market did not buy the “more hikes now” story. On PPI day, bond yields fell instead of rising. CME pointed to a strong rally in US Treasuries alongside the Fed officials’ pushback. When bond traders will not price in a hike, forex traders usually follow, and the dollar eases.
The simple lesson: markets trade what they think the Fed will do next, not how hot the last number was. A hot report only lifts the odds if the Fed sounds ready to act on it. This week the Fed sounded patient.
What this means for our DXY Bias Score
The score is still +6, Bullish DXY, and the maths still holds. The score counts what has been released: the September hike, the Fed’s own projections, CPI, PPI (which counts double after such a big miss), the unemployment measure, trader positioning and the Iran and Hormuz risk. The jobs and wages drivers pull it down.
The one driver that measures what the market expects next is the CME odds, and it is at zero because the odds are under 30%. If hike odds jump back over 30%, the score goes to +7. Also note that the positioning (COT) number is from the October 6 report, so it cannot show any change from this week yet.
That is why the score and the chart can disagree. The score is a scoreboard of what has happened. The chart shows what traders are doing with their money. Our reading is that the chart is looking past this week’s numbers to the next Fed move, which the market thinks is December. The score will not drop because of price alone. It only changes when data or the odds change.
The daily charts now
We use the same levels as our October 10 post, plus one more type of line. A break of structure is a level where price has broken past a recent swing high or low. When price closes beyond it, the old direction may be pausing or turning. All three charts below were taken on Friday morning (about 07:55 UTC), so today’s candle is not closed yet.
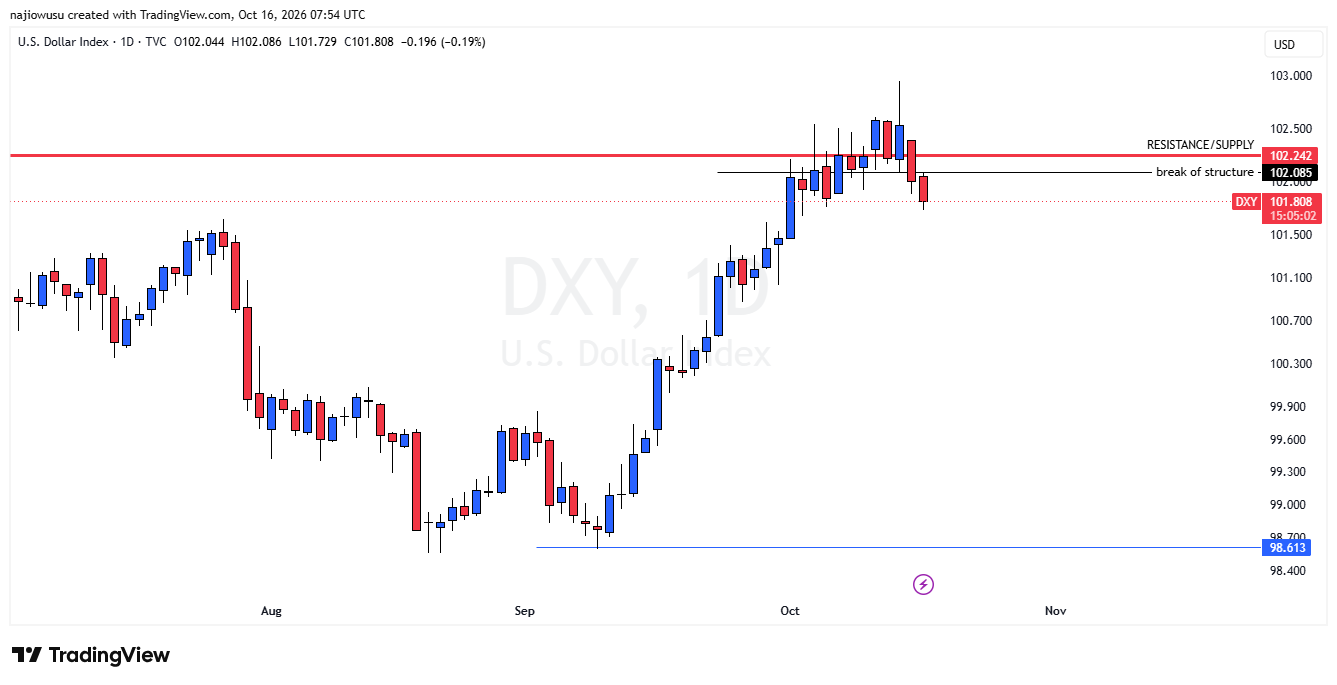
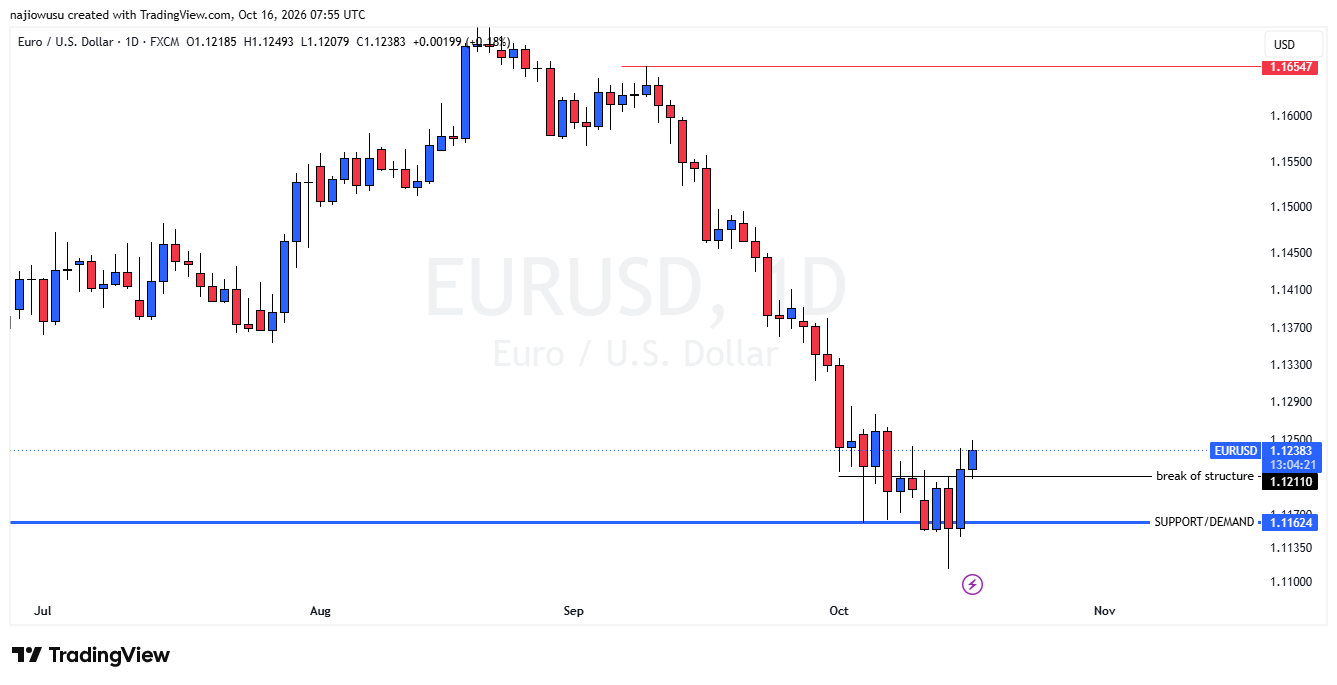
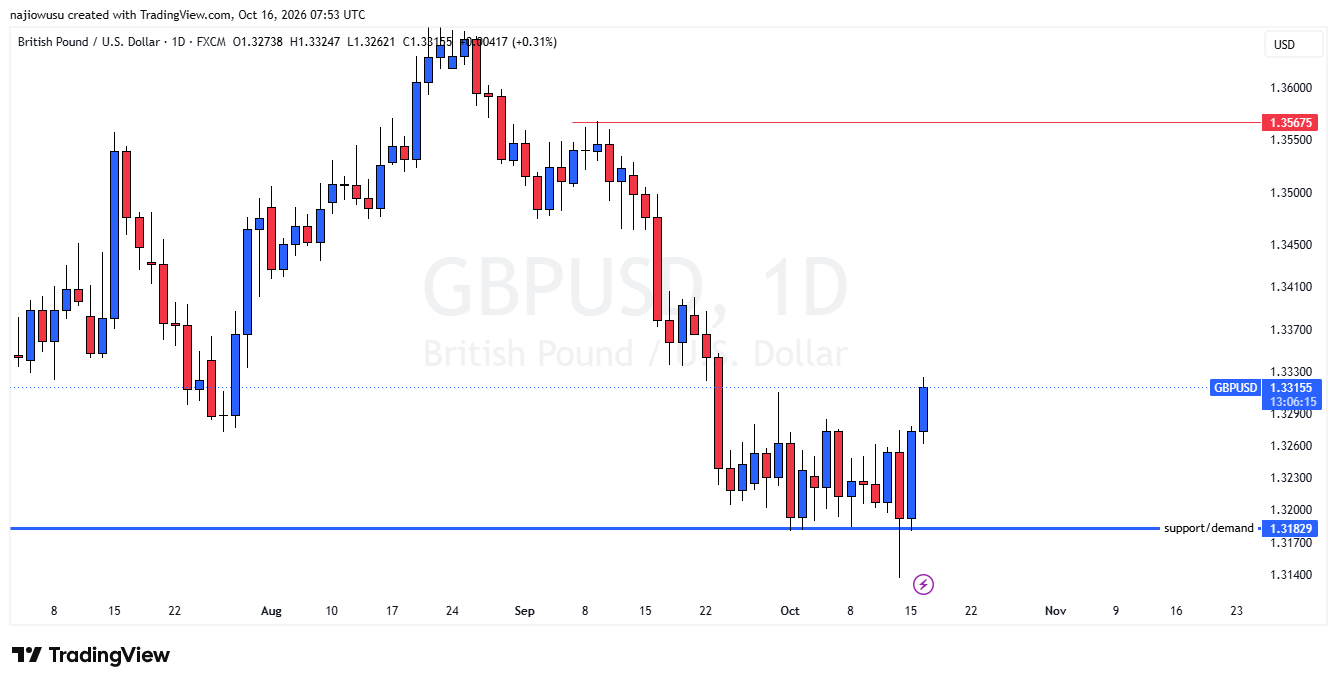
| DXY | EURUSD | GBPUSD | |
|---|---|---|---|
| Friday morning | 101.81 | 1.1238 | 1.3316 |
| Thursday close (about) | 102.00 | 1.1218 | 1.3274 |
| Key levels | Structure 102.085, resistance 102.242 | Structure 1.1211, support 1.1162 | Shift 1.3249, support 1.3183 |
| Where price is | Under both | Above structure | Above the shift level |
The Thursday closes are worked out from the daily change shown on each chart, and the CPI-day dips are read off the candles, so treat them as close, not exact.
What the charts are saying
- All three now agree. The dollar index is falling while EURUSD and GBPUSD are rising. The disagreement we pointed out on October 10 is gone.
- CPI day was a failed dollar move. All three pairs pushed toward a stronger dollar after the hot CPI, then reversed. The market tried the “dollar up” trade and rejected it.
- We should own this one. On October 10 we said hot inflation would point to the “GBPUSD joins the others” side, where the dollar gets stronger. The data was hot, and price went the other way, the side where GBPUSD was right and the dollar weakens. Price was reading the Fed, not the report.
- It is still early. Each level has only been crossed on one daily close, and Friday’s candles are not finished.
Two ways this could go from here
| Scenario A: the chart is right | Scenario B: the data wins | |
|---|---|---|
| Hike odds | Stay under 30% | Jump back over 30%, and the score goes to +7 |
| DXY | Stays under 102.085; a daily close above 102.242 would cancel this | Closes back above 102.242 |
| EURUSD | Holds above 1.1211, with 1.1162 as the line that must hold on dips | Closes back under 1.1211, then 1.1162 |
| GBPUSD | Holds above 1.3249, then 1.3183 | Closes under 1.3249, then 1.3183 |
| The dollar | Keeps softening | Gets stronger again |
| Gold and Bitcoin | Usually helped by a weaker dollar | Usually hurt by a stronger dollar |
| What a trader could look for | Buy setups on EURUSD or GBPUSD on pullbacks, and extra care with dollar buys | Sell setups on EURUSD or GBPUSD, or dollar buys once DXY is back above 102.242 |
What could push the odds back over 30%? A Fed official saying October is still open, bond yields rising again, or another jump in oil prices (the Iran and Hormuz story is still active in our tracker). If price stays between the levels in the table, stand aside. No trade is a fine decision.
A simple game plan
- Today: Friday’s daily candles are not closed. Wait for the closes before you judge any of these levels.
- Check the weekly chart. We have only looked at the daily chart here. Before trading, see whether the weekly agrees with it.
- Use the correlation rule. DXY, EURUSD and GBPUSD must tell the same story before you trade. Right now they do. If one breaks away again, stay out.
- Expect fewer Fed headlines. Fed officials normally stop speaking in public in the days before a meeting, and that quiet period begins this weekend. So the odds will mostly move with bond yields, oil and the chart.
- October 27–28 FOMC: there are no new projections at this meeting. Warsh does not like giving advance hints, so the statement and his news conference are where any message about December would come from. Watch the wording, not only the decision.
- Dates after that: PCE on October 29, jobs on November 6, CPI on November 10 and PPI on November 13.
- Risk: put your stop loss at a sensible chart level and risk only a small part of your account on each trade.
The risks
- 10.5% is low but not zero. The Fed could still hike in October, and the dollar would likely jump if it did.
- The hike odds change all day (they were about 28% early on Friday and 10.5% later) and sources read them at different times. The 30% line is our own scoring rule, not a market rule.
- The charts are a Friday-morning snapshot. Candles can change before they close, and the levels were read from our own charts.
- Our score and the chart disagree right now. One of them will be early, and we cannot tell you which.
- Never risk money you can’t afford to lose. This is education, not financial advice.
This data-to-score-to-chart flow is what our October YouTube series is built around, and the Macro Tracker shows the score as the odds and reports change it.