Here is the short version. This week the US dollar stayed strong and EURUSD kept falling, but GBPUSD went the other way. It turned bullish from support near 1.32 and has held that support all week. Next week brings two big US inflation reports: CPI on Wednesday, October 14 and PPI on Thursday, October 15. This post explains what GBPUSD might be hinting at and how you could plan for both outcomes.
What is happening, in plain English
Every one of these pairs has the US dollar on one side. When the dollar gets stronger, EURUSD and GBPUSD usually fall together. This week they didn't:
- Dollar index (DXY): bullish, so the dollar looks strong.
- EURUSD: bearish, falling. That fits a strong dollar.
- GBPUSD: bullish, rising. That does not fit.
Pairs that normally move together don't stay out of step for long. So one of two things will probably happen: either GBPUSD was right and the others catch up to it, or GBPUSD slips back and joins them. Next week's inflation numbers will likely decide which.
One warning: GBPUSD may be moving for UK reasons that have nothing to do with the US. Treat it as a clue, not a promise.
The three charts
Here are this week's daily charts. All three are sitting on a key level going into the inflation reports.
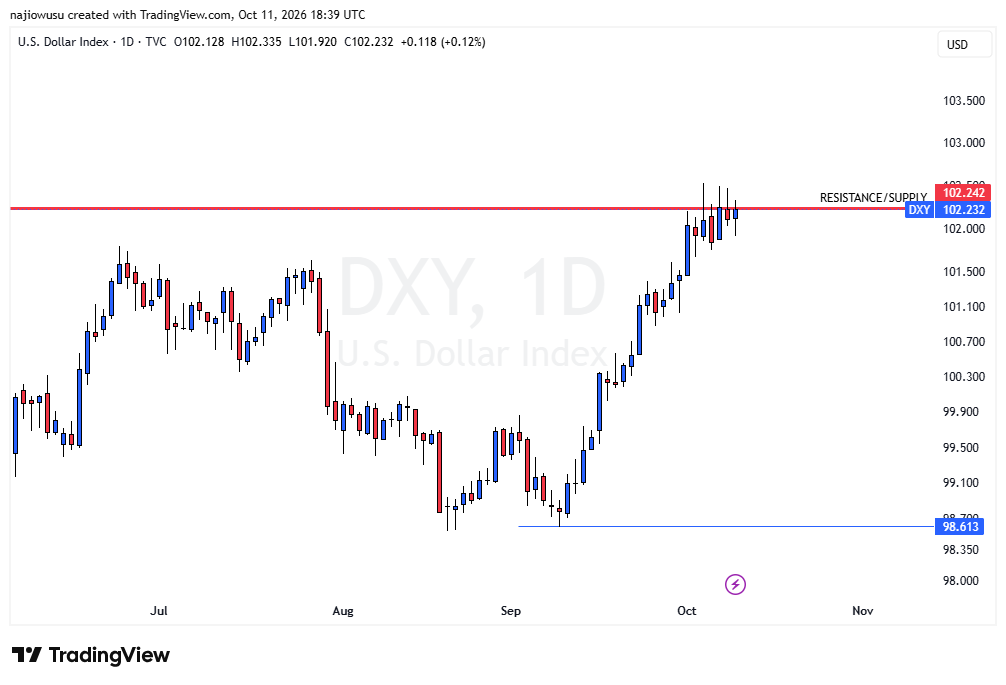
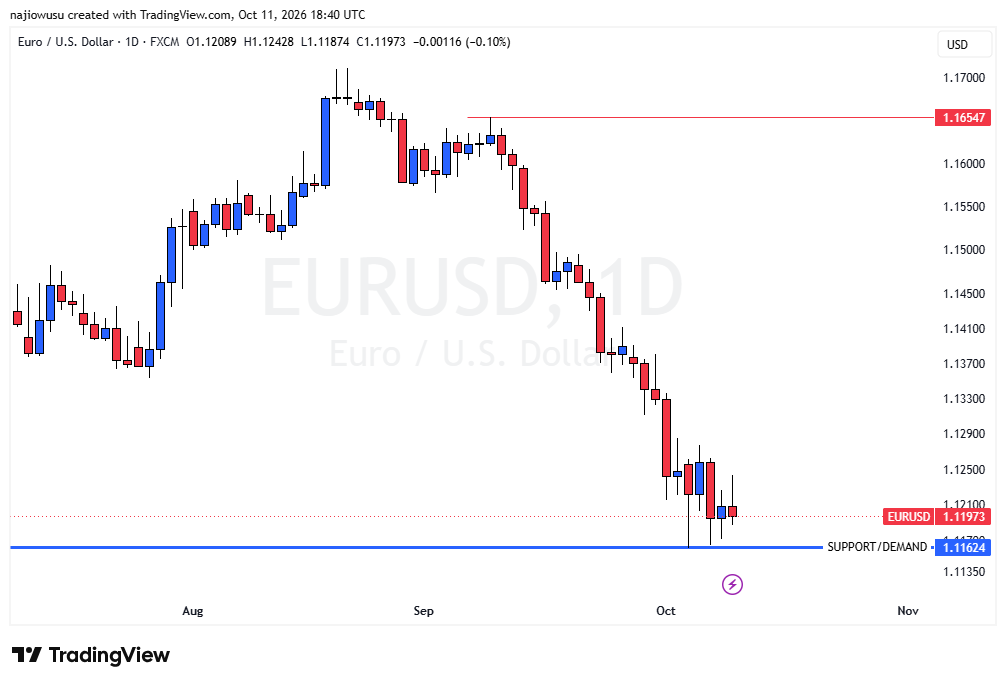
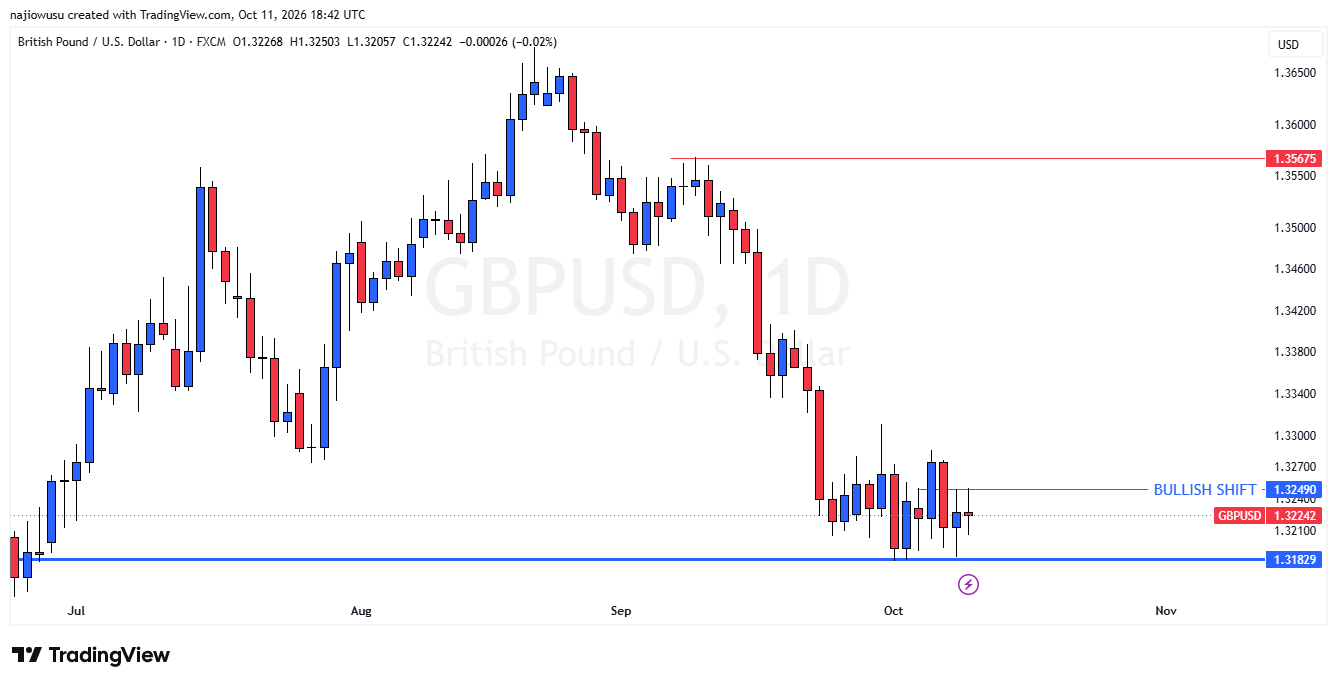
So the dollar index is at resistance, EURUSD is at support, and GBPUSD is between its support and its bullish shift level. All three are at decision points, which is why next week's reports matter so much.
Why inflation numbers move the dollar
When inflation is too high, the US central bank (the Fed) tends to raise interest rates, and higher rates usually make the dollar stronger. So hotter inflation usually helps the dollar, and cooler inflation usually hurts it.
- CPI shows how fast the prices of everyday things are rising for consumers.
- PPI shows price changes for producers and businesses. It often gives an early hint of where CPI is heading.
Right now the market does not expect a rate hike soon. September's jobs report was weak (29,000 jobs against 84,000 expected), and the chance of an October hike fell to 19.4%. Our DXY Bias Score has dropped from +8 to +4. It still says bullish, but it is weaker than before. At the same time, traders in the futures market are still mostly betting on a stronger dollar. That mix is why a surprise from the inflation reports could push the dollar either way.
The two scenarios
| Scenario A: GBPUSD was right | Scenario B: GBPUSD joins the others | |
|---|---|---|
| What you see first | GBPUSD holds above its support at 1.3183 | GBPUSD closes below 1.3183 |
| Levels on the other charts | DXY gets rejected near 102.24; EURUSD holds above 1.1162 | DXY closes above 102.24; EURUSD closes below 1.1162 |
| What inflation shows | The same or lower than last month | Higher than last month |
| The dollar | Gets weaker | Gets stronger |
| EURUSD and GBPUSD | EURUSD may catch up higher; GBPUSD holds | Both fall |
| Gold and Bitcoin | Usually helped by a weaker dollar | Usually hurt by a stronger dollar |
| What a trader could look for | Buy setups on EURUSD or GBPUSD | Sell setups on EURUSD or GBPUSD, and extra care with gold and Bitcoin buys |
A simple game plan
- Before the reports (now until Tuesday): don't open new trades just because of this clue. Mark these levels on your daily charts: GBPUSD 1.3183 (support) and 1.3249 (bullish shift), DXY 102.24 (resistance), and EURUSD 1.1162 (support). A GBPUSD daily close above 1.3249 would strengthen scenario A, and a close below 1.3183 points to scenario B.
- Wednesday, CPI: watch the number and how GBPUSD reacts. Don't trade the first few minutes, because prices jump around. Wait for the candle to close.
- Thursday, PPI: check whether it agrees with CPI. If both come in hot, or both come in soft, the picture is clear. If they disagree, stand aside. No trade is a fine decision.
- Then pick one scenario and trade it using your usual entry rules. Put your stop loss at a sensible chart level beyond the last swing high or low, and risk only a small part of your account on each trade (many traders use 1–2%). Our notional value guide shows how to check how big your trade really is.
- Gold and Bitcoin usually move the opposite way to the dollar. Our Bitcoin plan only buys if the price reaches $74,890 and the dollar gets weaker. One without the other is not a signal.
What our score could show
The DXY Bias Score is +4 today. It only reacts to released data, so here is what next week could do:
- Both reports hot: the score rises to about +5 or +6.
- Mixed results: the score stays between about +2 and +4.
- Both reports clearly soft: the score falls to about +1. It only reaches 0 (neutral) if PPI also comes in well below forecast.
That means the score will probably still say bullish even if the dollar starts to weaken on the chart. Price often moves before the score does, which is why we watch both.
The risks
- One week of GBPUSD acting differently is a small sample.
- Inflation reports can surprise in ways neither scenario covers.
- Never risk money you can't afford to lose. This is education, not financial advice.
This is the kind of setup our October YouTube series is built for: going from the data, to the score, to the chart, as each report comes out.