Update, October 21: We first published this on October 20, when it still read like a recap of the CPI and PPI week. We have now added Tuesday’s and Wednesday’s prices, our own daily chart with our levels, and rewritten the wording so it looks forward to the Fed meeting. The main change: gold has gone nowhere since last week’s inflation reports.
Last week, hot US inflation reports pushed gold down 1.6% in one day, and an even hotter one lifted it the next day. A week later, gold is almost back where it started: about $4,135 on Wednesday, still inside the same box it has traded in since the start of October. The short answer: gold is reacting to what the Fed might do about inflation, not to inflation itself, and with the Fed meeting on October 27–28 close, it is waiting. This post explains how last week played out day by day, where gold stands now on our chart, and what could move it before the Fed.
What gold did, day by day
Up to Monday these are approximate spot prices from news outlets. The Tuesday close and today’s numbers come from our own chart (FXCM feed). Different feeds quote slightly different levels, so treat each number as “about”.
| Day | Gold | What was going on |
|---|---|---|
| Tue Oct 13 Before CPI | About $4,165, inside a $4,100–$4,200 range | Traders waited for the inflation report. The chance of an October Fed hike was about 22%. |
| Wed Oct 14 CPI | Fell about 1.6% (roughly $65 in half an hour). Low near $4,073, close near $4,100 | CPI came in hotter than forecast. The chance of an October hike jumped to nearly 50%. Bond yields and the dollar rose. |
| Thu Oct 15 PPI | Rose about 1.1% to 1.3%, to about $4,150 | PPI was far hotter than forecast, yet bond yields and the dollar fell. The chance of an October hike dropped below 30%. |
| Fri Oct 16 | Closed about $4,166, down about 0.7% on the week | Fed Chair Warsh gave no signal about October. Hike odds fell further. |
| Mon Oct 19 | Fell about 0.6%, closing about $4,138 | The dollar and bond yields firmed again. Markets still priced about a 90% chance of a December hike. |
| Tue Oct 20 | Dipped to about $4,120 early, closed about $4,124 on our chart | Oil rose to about $110 after Houthi claims of strikes on Saudi energy sites (Saudi Arabia had not confirmed any damage). The 10-year yield rose to about 5.14%. Markets priced about an 82% chance the Fed holds in October and about an 89% chance of a December hike. |
| Wed Oct 21 Today | About $4,135 at midday (up about 0.3%), after trading between about $4,106 and $4,142 | A quiet day so far. Gold is bouncing a little but still sits between the same two levels. Oil is still near $110. |
Why gold behaved this way
- Gold pays no interest, so yields matter more than inflation. A US government bond now pays about 5%. When traders think the Fed will raise rates, bond yields rise, the dollar usually rises too, and holding gold looks less attractive. That is what happened on CPI day: the hot report raised hike bets, and gold fell with the dollar and yields rising.
- PPI day proved the point. The PPI report was hotter than the CPI report, yet gold went up. Bond yields fell that day, and reports said part of the reason was investors selling technology shares and moving into bonds (we explained this in our yields guide). Hike odds also fell. With yields and the dollar lower, gold recovered. Gold followed the rate story, not the inflation number.
- A December hike is already expected. Markets still priced about an 89% chance of a hike by December on Tuesday. That gives gold a ceiling. When traders think the Fed may move sooner or sound tougher, gold finds it hard to rise. It has struggled to clear the $4,200 area, and our chart marks weekly supply just above it at $4,217.58.
- Oil is now part of the story. Oil near $110 keeps inflation worries alive, which supports the hike bets and pushes yields up. Gold normally gains from Gulf tensions, but for now the yield effect is stronger than the safe-haven effect.
Why gold has not fallen further
Gold is not cheap against rates: a bond paying about 5% is real competition. Yet gold has stayed above its July lows, near $4,000. Part of the reason, according to reports, is central banks. Reports citing World Gold Council data said central banks bought at a record pace in the second quarter, and later reports said the buying carried on. Central banks tend to buy slowly and for the long term, so they can cushion falls without pushing the price up quickly.
For perspective, gold is still about a quarter below its January record, which was near $5,600. It has been in a correction since. Nobody knows whether the correction is over, and you should be suspicious of anyone who says they do.
How this fits our DXY Bias Score
Our DXY Bias Score is +6, which reads Bullish DXY. Gold usually moves the opposite way to the dollar, so a strong-dollar reading is a headwind for gold. Last week showed both sides: gold fell when the dollar jumped on CPI day and rose when the dollar eased on PPI day. The link is not perfect, though. One analyst argued recently that the dollar matters less for gold than it used to, and that yields and Gulf tensions matter more. So use the score as one input, next to bond yields, not as a signal on its own.
Our daily chart: the box gold is stuck in
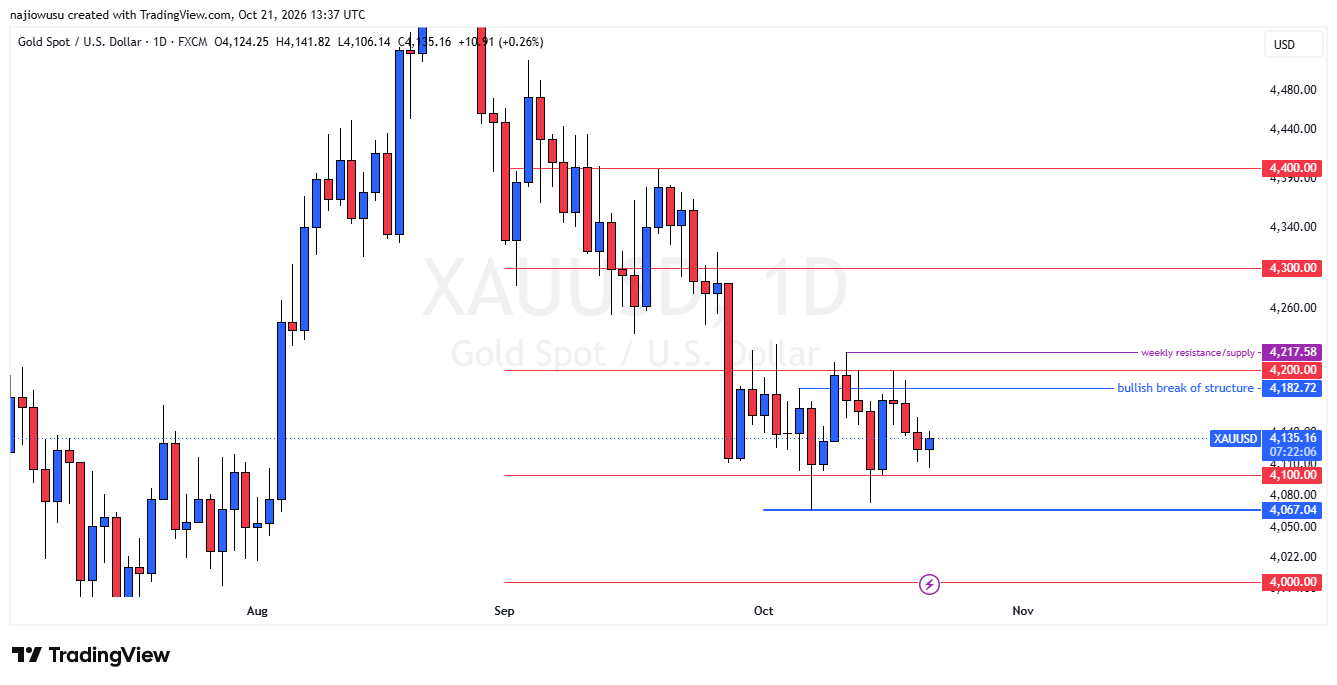
| Our level | What it means |
|---|---|
| $4,300 and $4,400 | Higher resistance marked on our chart. Gold is far from both for now. |
| $4,217.58 | Weekly resistance, or supply: the top of the box. |
| $4,200 | Round-number resistance just under the weekly level. |
| $4,182.72 | Our bullish break of structure, the recent swing high. A daily close above it would be the first sign the sellers are losing control. |
| $4,100 | Support that has held several times, including on CPI day. |
| $4,067.04 | The low of the box. A daily close below it would break the range to the downside. |
| $4,000 | The big round number and the next marked support. |
Levels analysts are watching
These are levels published by news and analysis sites, not our own chart levels. They overlap with ours, which is a useful check. Check them against your own chart before you use them.
| Above the price | Below the price |
|---|---|
| About $4,150–$4,160: the first hurdle | About $4,100: the round number that held on CPI day |
| $4,200–$4,240: the top of the range and the zone gold fell away from | $4,073: the CPI-day low quoted by news outlets |
| About $4,227: the 200-period moving average some analysts follow, then about $4,330 | About $4,030, then $3,996 and $3,959: the July lows, the next big supports |
What could move gold before the Fed
- The Fed meeting, October 27–28. Markets expect no change. The Fed will not publish new projections, so the message will come from the statement and Chair Warsh’s press conference. A tone that points to a December hike would likely be bad for gold. A relaxed tone would likely help it.
- PCE inflation, October 29. This is the Fed’s favourite inflation measure, and it comes the day after the decision.
- The US jobs report, November 6. Weak jobs have been the main reason the Fed has not rushed.
- Oil and the Gulf. Oil near $110 lifts inflation worries and yields at the same time. That can hurt gold even though it also raises safe-haven demand. Reports of attacks on Saudi energy sites were not confirmed by Saudi Arabia, so headlines here can swing both oil and gold.
- Quiet days. The Fed is in its quiet period, so there are no Fed speeches before the meeting. Expect gold to follow yields and the dollar.
What a trader could look for
This is education, not a trade recommendation.
- Watch the 10-year yield and the dollar index together with gold. If gold falls while yields and the dollar are falling too, something else is going on and you should be careful. If all three agree, the move is more trustworthy.
- Respect the range. On our chart gold has spent weeks between $4,067 and $4,217. A daily close above the $4,182.72 break of structure, or below $4,067.04, not a quick spike, is a better sign of a real move. Until then, the middle of a box is a poor place to start a trade.
- Do not trade the first minutes of a big report. On CPI day gold moved about $65 in half an hour and then recovered. On most brokers 0.01 lot is one ounce of gold, so that move is $65 on 0.01 lot and $650 on 0.1 lot. Check the size of your trade first: our notional value guide shows how.
- Remember the Bitcoin plan. Gold and Bitcoin often react to the same things: the dollar and yields. Our Bitcoin plan only buys if the price reaches $74,890 and the dollar gets weaker. Nothing in the past week gave a clear weaker-dollar signal.
The risks
- Gold can move fast and in both directions. Use a stop loss and risk only a small part of your account on any trade.
- A surprise from the Fed, oil or the Gulf can break any pattern in this post.
- Price levels differ between outlets and brokers. Use your own broker’s chart.
- This post was written on October 20 and updated on October 21, and the market moves daily. Check the live numbers before you act. Not financial advice.
Where the numbers come from
Price and market moves were taken from reports by Kitco (CPI day), CNBC and FXStreet (PPI day), Vantage (Friday close and Monday) and Business Recorder (Monday, Fed odds), FinanceFeeds (Tuesday: price, 10-year yield, oil, Fed odds and the $4,227 level, citing Kitco, FX Leaders and Reuters) and Vantage (Wednesday morning). The Tuesday close and today’s numbers, and the chart levels, are from our own TradingView chart. Central bank buying comes from reports citing World Gold Council data. Our own tracker figures are on the Macro Tracker. We will go through the Fed decision in the next post.