Update, October 1: The condition this post set has been met — the September monthly candle closed above $82,836. SOG Capital is now calling the bottom in on Bitcoin, though not yet buying. See the full update and trade plan for where we're watching next. The rest of this post is left as originally published.
Bitcoin just pushed above $82,836 — the monthly high we've been watching since our $80,000 Wall call — and crypto Twitter has already decided what it means. Timelines are full of "the bull run is back" and "here we go again." We're not joining in.
Not because we don't want the next bull run. Because a break above a level and a close above a level are two different things, and only one of them has actually happened.
A Break Isn't a Close
Here's the distinction the excitement is skipping over. Bitcoin trading above $82,836 right now, mid-month, tells you price touched that level and pushed through it. It doesn't tell you the market actually settled there. Price can spike above an obvious, widely-watched level — and $82,836 was about as widely watched as levels get — trigger a wave of breakout buying and stop-losses, and then fail to hold it by the time the candle that matters actually closes. That pattern has a name traders use often: a false breakout, or a liquidity grab.
We're not saying that's definitely what's happening here. We're saying we don't know yet — and neither does anyone celebrating a breakout that hasn't been confirmed.
The Bar We're Actually Watching
Until Bitcoin's monthly candle actually closes above $82,836 — which won't be known until the end of September — we continue to treat this as an unconfirmed break, not a genuine trend change. A monthly close above that level would be real, meaningful evidence that the bigger downtrend is over. A monthly close back below it would mean this entire move was exactly the kind of trap that gets dressed up as a breakout while it's happening.
This isn't a new framework for us — it's the same higher-timeframe-first logic behind every multi-timeframe call on this blog. The monthly is the slowest, most dominant chart we track, and it doesn't get overruled by a few days of price action, however exciting those days feel in the moment.
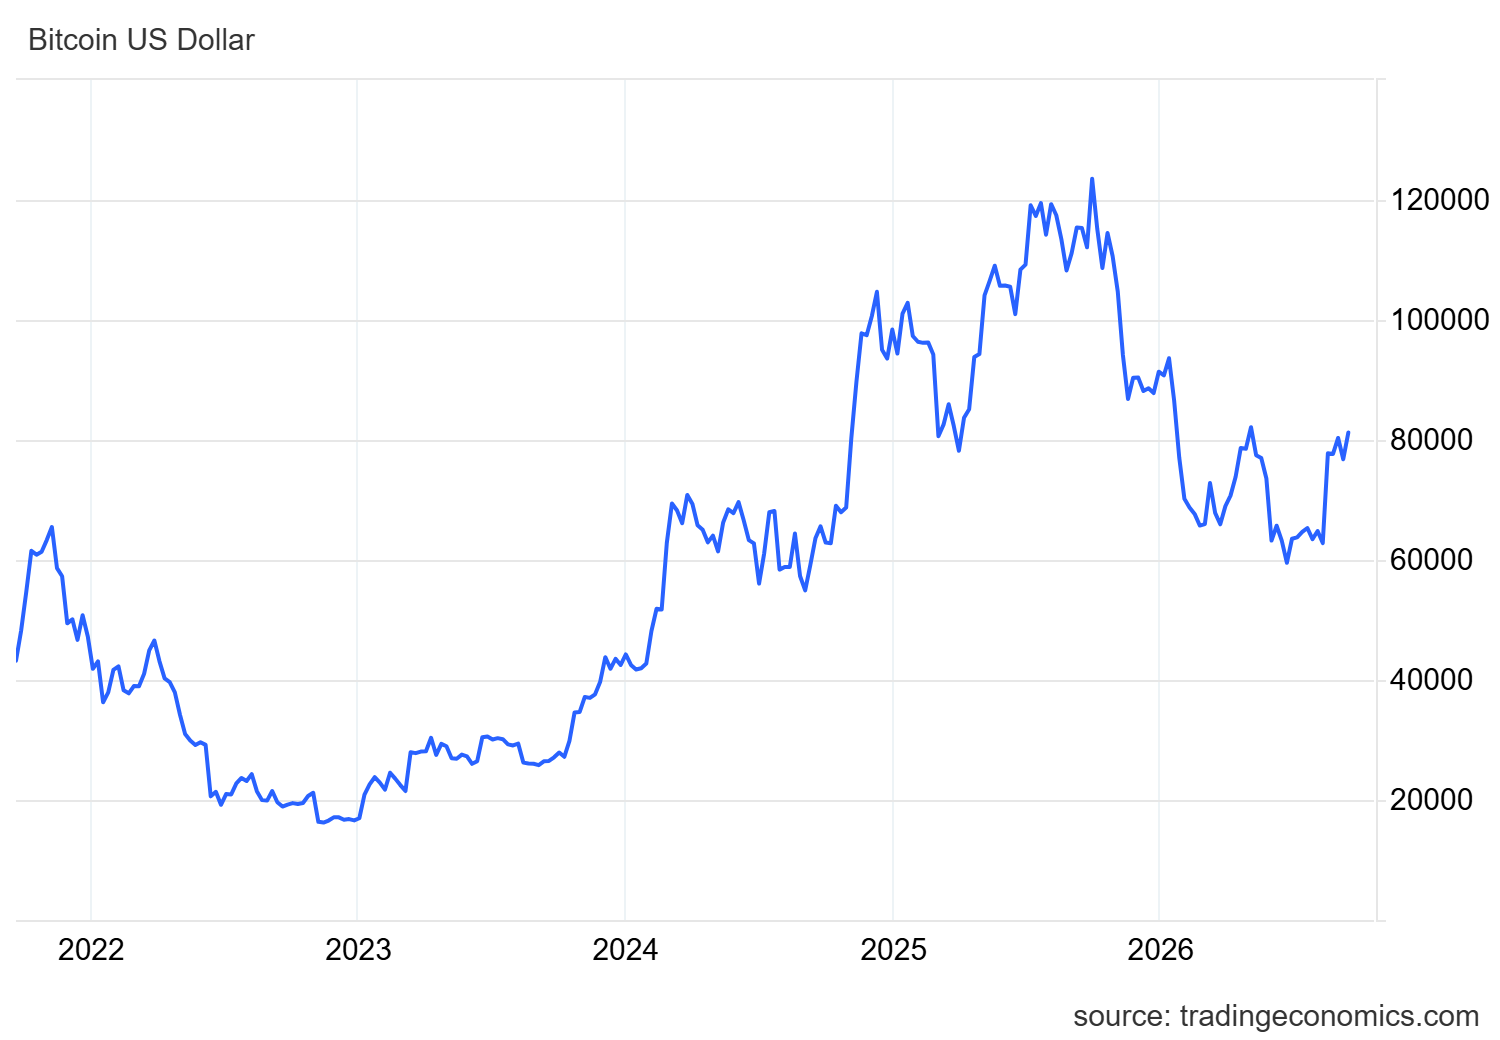
Zoom out and the context matters too. This is a multi-year chart that ran from roughly $17,000 at the 2022 lows to a cycle high above $123,000 last year, before rolling over into the pullback we've been tracking. A move back up toward the old highs after a decline like that is exactly the kind of level where a market either confirms a genuine new leg higher, or hands out one last excited breakout before rolling over again. We won't know which this is until the month actually closes.
Why the Dollar Reinforces This Rather Than Argues Against It
If the dollar were falling apart right now, we'd be more willing to entertain the bullish case despite the unconfirmed close. It isn't. The dollar is sitting supported on both counts that matter: the macro data behind the SOG Capital DXY Bias Score remains bullish following the Fed's hawkish September rate hike, and the dollar's own charts back that up technically rather than contradicting it.
Bitcoin and the dollar have generally moved in opposite directions — a supported dollar is historically a headwind for Bitcoin, not a tailwind. So the backdrop this breakout is happening against isn't a clean, dollar-weakness-fueled risk rally. It's a breakout attempt into a currency headwind, which is a genuinely different, weaker setup than the kind of dollar-collapse-driven rally that tends to actually stick.
Two Ways September Can End
This becomes real. A confirmed monthly close above the old high, especially against a supported dollar, would be a genuinely bullish signal worth taking seriously — the kind of break that survives contact with a full month of trading rather than just a few excited days of it. We'd revisit the bearish call at that point, not defend it out of stubbornness.
This was the trap it currently looks like. A failed close reinforces the bearish monthly thesis and raises the odds of price working back down toward the demand zone closer to $75,000 — the level that's mattered on pullbacks throughout this cycle. Everyone excited about the "breakout" would have been celebrating a wick, not a trend change.
The Bottom Line
Bitcoin trading above $82,836 is a fact. Bitcoin having actually broken its bigger downtrend is not — not yet. Those are different claims, and the gap between them is exactly one monthly candle close, still weeks away from being confirmed. Add a dollar that's supported on both a macro and technical basis, working against Bitcoin rather than for it, and we see more reason for caution here than reason to celebrate. We're not rooting against the next bull run. We're just not calling it early because a level got touched.
The live DXY Bias Score behind the dollar side of this call — every driver, updated the moment new data lands — is at the SOG Capital Macro Tracker.