Two stories we've been following separately for the past week just started pointing the same direction at the same time. The US Dollar has been building a genuinely bullish case since the August jobs report, and yesterday it took another step forward: GBPUSD and EURUSD both closed the day bearish, meaning the dollar side of those two pairs won on the day. Meanwhile, the Japanese Yen — which we flagged five days ago as running into monthly resistance after its intervention-driven rally — is still stuck at that wall, looking more tired by the day.
Put a strengthening dollar next to a weakening yen, and there's one pair that benefits from both sides of that trade at once: USDJPY. Here's the full picture, in plain terms, and why we're now watching this one for a long.
A Quick Refresher, for Anyone New to How We Think About This
Before the technical detail, two quick definitions, because everything below builds on them:
- USDJPY is the price of one US Dollar measured in Japanese Yen. When USDJPY goes up, it means the dollar is getting stronger against the yen (or the yen is getting weaker against the dollar — same thing, two ways of saying it). When USDJPY goes down, the opposite is true.
- We look at three "timeframes" for every pair we trade — monthly (the big-picture trend, spanning months), weekly (the medium-term trend, spanning weeks), and daily (what's happening right now, day to day). The general rule: the higher timeframe (monthly, then weekly) usually wins in the end, but the daily is often the first place a change of direction shows up — it's the early warning sign, not the final word.
Story One: The Dollar's Alignment Just Got a Lot Cleaner
We've been tracking the US Dollar's strength through our DXY Bias Score, which has been climbing steadily on a run of hot economic data. But a strong macro score is only half the picture — we also want to see it show up in the actual charts, specifically in how the dollar is trading against its two biggest counterparts, the British Pound (GBPUSD) and the Euro (EURUSD).
As of yesterday's close, that confirmation arrived. GBPUSD and EURUSD both finished the day bearish — which, remember, means the dollar side won both of those fights. That's the daily timeframe now fully lined up behind the dollar across the board.
| Timeframe | Current bias | What it means |
|---|---|---|
| Weekly | Bearish | The medium-term trend still technically favors dollar weakness — this hasn't flipped yet |
| Daily | Bullish — confirmed via GBPUSD & EURUSD | Right now, today, the dollar is winning — and it's showing up consistently, not just on one pair |
This is exactly the kind of setup we flagged a few days ago as worth waiting for: a daily flip that, if it holds long enough, has the potential to eventually drag the weekly timeframe around with it. It hasn't done that yet — the weekly is still bearish on the dollar — but the daily is no longer a lone signal. It's now a fully confirmed, multi-pair read.
Story Two: The Yen's Rally Is Running Out of Road
On September 10, we wrote about the Yen Index stalling at monthly resistance around 692.9, after a sharp rally driven by intervention. At the time, the monthly trend for the yen was bearish (the dominant, higher-timeframe read), while the weekly and daily were still bullish — meaning the yen's near-term strength was pushing up against a ceiling that the bigger trend didn't support.
We also said what would confirm that resistance was doing its job: a structural shift on the daily timeframe to the downside. That's precisely what's now unfolding. The yen's push higher has stalled, and the daily is starting to show the kind of tired, rejected price action you'd expect right before a level like that wins.
| Timeframe | Current bias | What it means |
|---|---|---|
| Monthly | Bearish (dominant) | The bigger trend has never actually supported the yen's rally into resistance |
| Weekly | Bullish | Still technically intact, but this is the timeframe most at risk of flipping next |
| Daily | Stalling / turning bearish | The early warning sign we said to watch for — and it's now showing up |
A weakening yen and a strengthening dollar are two separate stories that happen to point at exactly the same trade.
What the USDJPY Chart Itself Is Showing
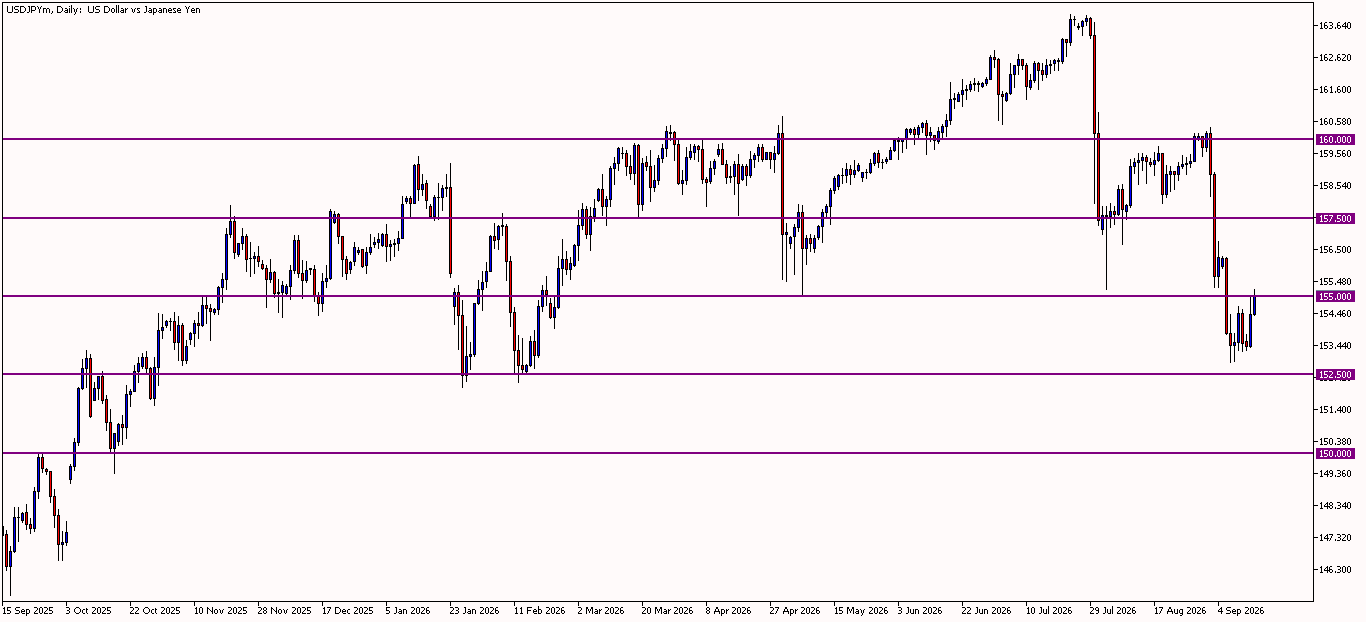
Zoom out on the actual USDJPY chart and the bigger story lines up with everything above. Going back to last September, USDJPY has been in a strong, sustained uptrend — climbing from the mid-146s all the way up past 163 by late July. That entire move is the dollar strengthening against the yen over the better part of a year.
Late July into August is where the sharp part of the story happened: USDJPY dropped hard, from the mid-160s all the way down to the low 153s. That's the yen's intervention-driven rally we've been tracking — a genuine, aggressive counter-move against the bigger uptrend, not a random wobble.
Since that drop, price has been carving out a base and working back up toward 155.000 — a level that's acted as both support and resistance multiple times on this chart already. That's exactly where price sits today: pushing back up into a well-tested level, at the same time both of the fundamental stories above (dollar strength, yen exhaustion) are lining up in its favor.
The Level That Confirms or Kills This
155.000 is the line in the sand. A daily close that reclaims this level and holds above it would fit everything above — a strengthening dollar and a fading yen pushing USDJPY higher, with 157.500 and then 160.000 as the next levels to watch above that. A failure to hold above 155.000, and especially a slide back down toward 152.500, would weaken this thesis and suggest the yen still has more fight left in it than the daily charts currently suggest.
Why We're Calling This an Emerging Setup, Not a Done Deal
It's worth being direct about what hasn't happened yet. The weekly timeframe on both sides of this trade still disagrees with the daily: DXY weekly is still bearish, and the Yen Index weekly is still bullish. Weekly is a stronger, more dominant signal than daily, in the same way monthly is stronger than weekly. So right now, we have the early, faster-moving timeframe (daily) lining up in favor of a dollar-yen long, while the slower, more dominant timeframe (weekly) hasn't caught up yet.
That's not a reason to dismiss the setup — it's exactly how a genuine higher-timeframe shift usually begins. The daily moves first. If it holds its direction for long enough, it starts to drag the weekly around with it, the same pattern we're separately watching play out on Bitcoin's higher timeframes right now. But it is a reason to treat this as a setup that's forming, not one that's already fully confirmed on every timeframe that matters.
The Bottom Line
Two stories, one trade. The dollar just confirmed a clean daily bullish alignment across GBPUSD and EURUSD, backed by a DXY Bias Score that's been climbing all cycle. The Japanese Yen, at the same time, is stalling exactly where we said it would — at monthly resistance, with the daily now showing the early signs of rolling over. Put those two together and USDJPY has a genuine case for a long, with 155.000 as the level that decides whether this keeps building or stalls out like the yen's own rally just did. The weekly timeframe on both sides of this trade hasn't confirmed yet — which is exactly why this is one to watch closely into the days ahead, not one to chase blindly.
The live DXY Bias Score behind this call — every driver, updated the moment new data lands — is at the SOG Capital Macro Tracker.