Gold's bigger story hasn't changed: the monthly trend is still bullish, and even in a year that's mostly been a grind lower for the metal, it still managed a real bounce from $4,000 up to $4,500 across July and August. The day after the Fed's rate hike, the near-term charts got choppy on dollar strength — and true to form for fast timeframes, that near-term picture has already shifted more than once since.
Here's the full multi-timeframe read, why our overall bias is built to not flinch every time a fast chart flips, and the exact level that would actually change our view.
SOG Capital's overall bias on any pair is set by the monthly and weekly timeframes — the slow-moving charts that don't flip on a single session's dollar move. The daily, 4-hour, and 1-hour charts below are near-term signals, and they are genuinely fast-moving: more than one has already flipped direction since this cascade started. That's normal, not a reason to rewrite the headline call. See the section below, "Why a fast timeframe flip doesn't change our overall bias," for exactly why we frame it this way.
Why the dollar is pushing gold around right now
Gold is priced and traded in US dollars around the world. When the dollar gets stronger, gold gets more expensive for anyone buying it with a different currency, which tends to cool demand and pressure the price. Higher US interest rates add a second layer of pressure: gold doesn't pay any interest of its own, so when interest rates on dollar-based savings and bonds go up, holding gold instead becomes relatively less attractive.
Both of those things just happened at once. The Fed hiked rates 25bps to 3.75%–4.00% by a unanimous 12–0 vote, with a hawkish dot plot pointing to more hikes before year-end. The SOG Capital DXY Bias Score jumped to +8 on the back of it — the highest reading of this entire cascade. A dollar that strong, landing right after a hike, is exactly the kind of backdrop that leans on gold in the short term, even while gold's own bigger trend points the other way.
The multi-timeframe picture, top to bottom
Here's where every timeframe currently stands, from the big picture down to the fastest-moving chart. The bottom two rows are the ones worth watching for updates — they're the fastest-moving and most likely to have shifted again by the time you're reading this:
| Timeframe | Current bias | Context |
|---|---|---|
| Monthly | Bullish (sets the overall bias) | Trading inside a broad $4,000–$5,000 range; bounced from $4,000 to $4,500 in July–August despite an otherwise bearish year |
| Weekly | Bullish (sets the overall bias) | Lined up with the monthly trend |
| Daily | Bearish | Driven by the bullish dollar, both macro (DXY Bias Score) and technical — currently the lone holdout against the four other timeframes |
| 4-Hour | Bullish | Flipped back in line with the monthly and weekly, breaking away from the daily |
| 1-Hour | Bullish | Already bullish before the 4-hour flipped to join it |
The overall bias — monthly and weekly — is bullish, and nothing here changes that. On the faster timeframes, the daily is now the lone holdout: 4-hour has flipped back in line with the 1-hour, both bullish, leaving only the daily still pointed down. That's a genuinely fast-moving picture, and it's a good example of exactly why we don't let daily/4H/1H swings redefine the headline call — more on that below.
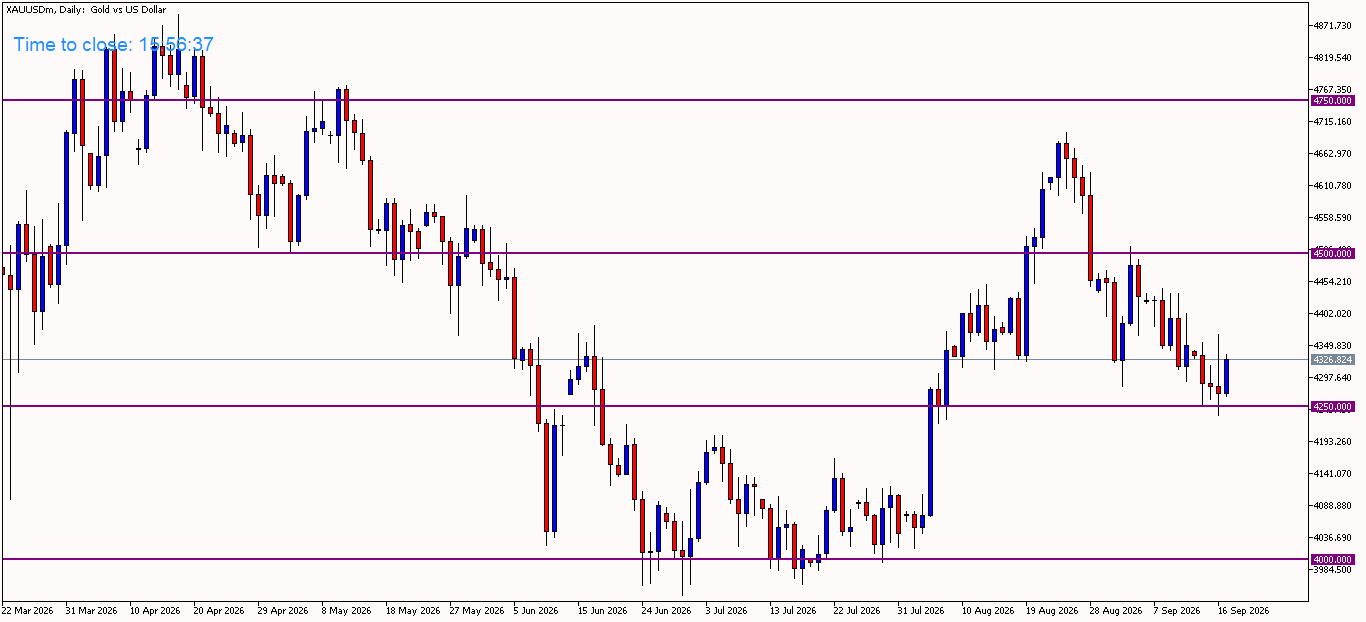
Zoom out on the chart itself and the story matches. Gold spent the spring falling from the $4,750 area down toward $4,000, then spent June and early July grinding sideways near the bottom of that range before the sharp bounce back up to $4,500 through August. Since then it's pulled back again, and price is currently sitting above $4,250 — a level that's already acted as both support and resistance earlier on this same chart.
Two paths from here, and the 1-hour chart decides which one
With the 4-hour now bullish alongside the 1-hour, the daily is the one holdout left. Whichever way it resolves will likely pull the picture toward full alignment, one direction or the other.
If the daily flips bullish too, every timeframe from monthly down to 1-hour is pointed the same way. That would be the cleanest possible confirmation that this was always a retracement, not a reversal — and it would put gold's bigger uptrend back in full technical agreement with itself.
If the daily instead holds its bearish stance and pulls the 4-hour back down with it — a real possibility, since the 4-hour just demonstrated how quickly it can flip — the fast timeframes would realign bearish again, keeping $4,250 in play as a level sellers could test.
$4,250 is the level to watch, regardless of which way the daily and 4-hour are pointing on any given day. Gold is currently trading above it. A daily close that breaks and holds below $4,250 would open the path toward $4,000 — the bottom of the broader monthly range. Holding above $4,250 keeps the door open for the bigger bullish trend to reassert itself across every timeframe.
Why a fast timeframe flip doesn't change our overall bias
The 4-hour chart flipping from bearish to bullish within a day of this setup first forming is a useful, live example of something worth spelling out clearly: the faster a timeframe moves, the less weight it gets in our overall bias, precisely because it's expected to flip back and forth like this. A 1-hour or 4-hour chart can reverse direction several times in a single week without that meaning anything has actually changed about where gold is headed over the coming months.
That's why SOG Capital's overall bias on any pair is set by the monthly and weekly timeframes only — the two slowest, most dominant charts, which don't move on a single session's dollar swing. The daily, 4-hour, and 1-hour are reported here as near-term signals worth watching, not as inputs that get to overrule the headline call. A move on those faster charts only starts to matter for the overall bias if it holds long enough, and spreads far enough up the timeframe ladder, to actually drag the weekly along with it — and even then, the weekly would need to pull the monthly before the core thesis genuinely changes. One 4-hour flip is nowhere close to that bar, and neither, on its own, would a second or third one.
Practically, this means a reader coming back to this post an hour, a day, or a week from now might find the daily or 4-hour row in the table above has flipped again — and that's fine. The overall bias printed at the top of this post stays bullish unless the monthly or weekly actually change, and we'll say so plainly if and when they do.
The Bottom Line
Gold's overall bias is unchanged and stays bullish: monthly and weekly both point the same way, and that's what actually sets our headline call, not whatever the daily or 4-hour happen to be doing on a given session. What's genuinely moved is the near-term picture, and it's moved fast — a resurgent post-hike dollar first pushed the daily and 4-hour bearish, then the 4-hour already flipped back to join the 1-hour, leaving the daily as the lone bearish holdout among the five timeframes. $4,250 remains the level that matters: hold it, and the fast timeframes falling back in line with the bullish overall picture becomes the more likely outcome; lose it, and $4,000 comes back into view. Either way, don't expect us to redraw the headline bias here every time the daily or 4-hour flips again — that's exactly the kind of noise the framework above is built to filter out.
The live DXY Bias Score behind the dollar side of this call — every driver, updated the moment new data lands — is at the SOG Capital Macro Tracker.