Before the market opens, here is a simple, plain-English look at three charts: the dollar index (DXY), EURUSD and GBPUSD. We mark the levels that matter, run our agreement check, and list what could move things this week. The short version: the dollar has a bullish macro score but has not broken out, EURUSD supports that story, and GBPUSD does not.
The dollar index (DXY): a bullish score, but price is stuck
Our Macro Tracker says +5, Bullish DXY. The chart says: “not yet”.
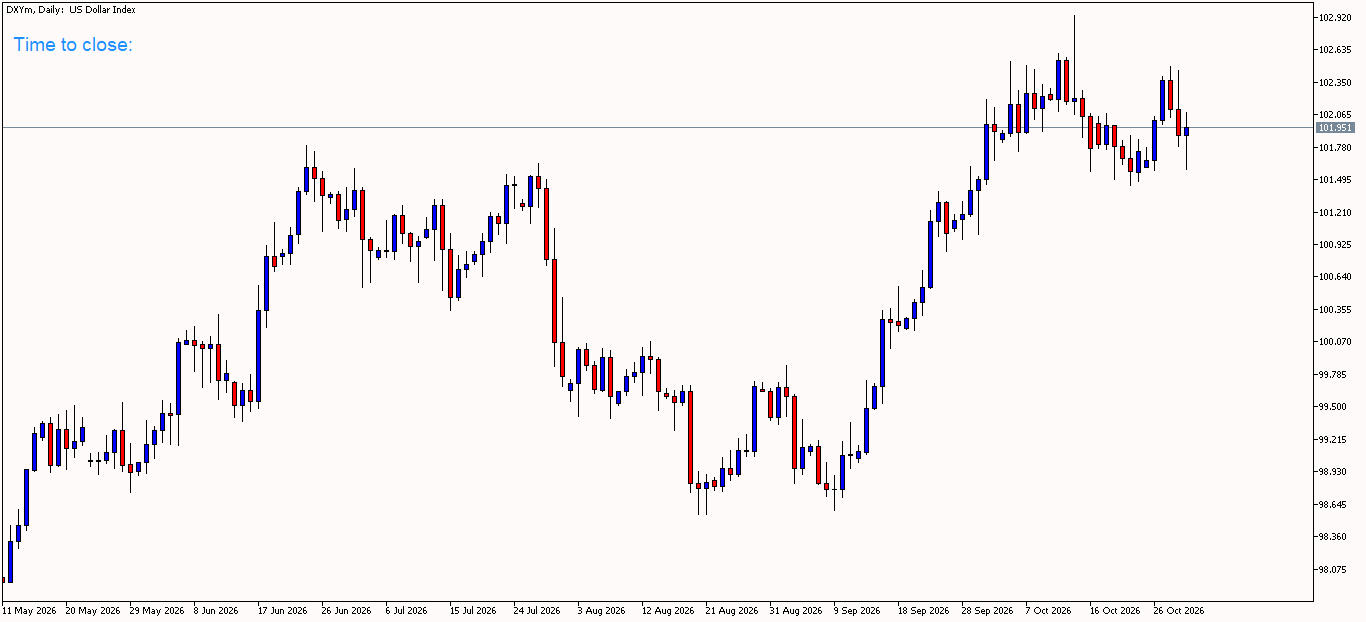
Here is what the daily chart shows:
- The range. Since early October the index has moved between about 101.45 (the floor) and 102.50 (the ceiling). Think of it as a room with a low ceiling and a hard floor.
- Last week. Buyers pushed up to about 102.4, sellers pushed back, and Friday finished with a small candle and a lower wick near 101.5. The wick says buyers defended the floor, but they did not break the ceiling.
- The spike. The early-October high near 102.9 left a long upper wick. Buyers reached it and could not stay there.
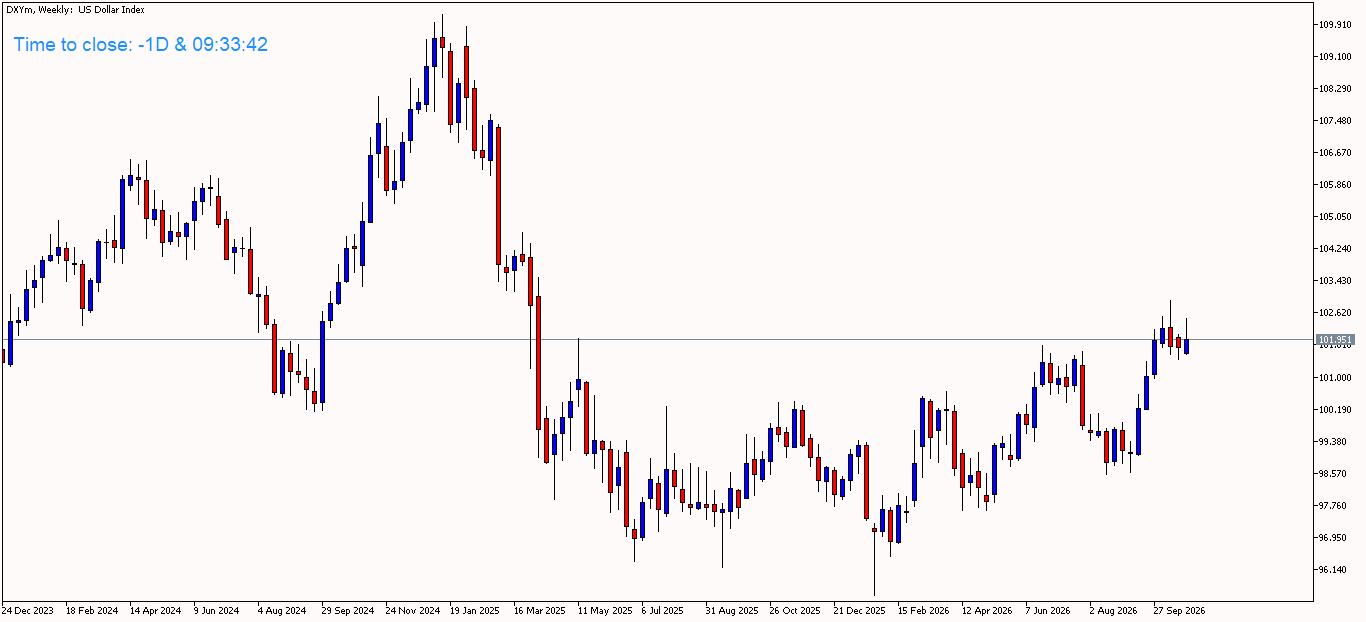
The weekly chart tells the same story. After a strong climb, the last four weekly candles are small-bodied. That means traders are undecided. The monthly chart shows October closing higher, but with a long wick up to about 103, so buyers reached high and gave a lot of it back.
The levels that matter:
| Level | What it means |
|---|---|
| About 102.90 | The October high. A close above this would be a big signal. |
| About 102.50 | The ceiling of the range. A daily close above it, and holding, is the first sign of a breakout. |
| 101.951 | Friday’s close, in the middle of the range. |
| About 101.45 | The floor of the range. A daily close below it would go against our bullish score and say wait. |
EURUSD: the cleanest chart, sitting on support
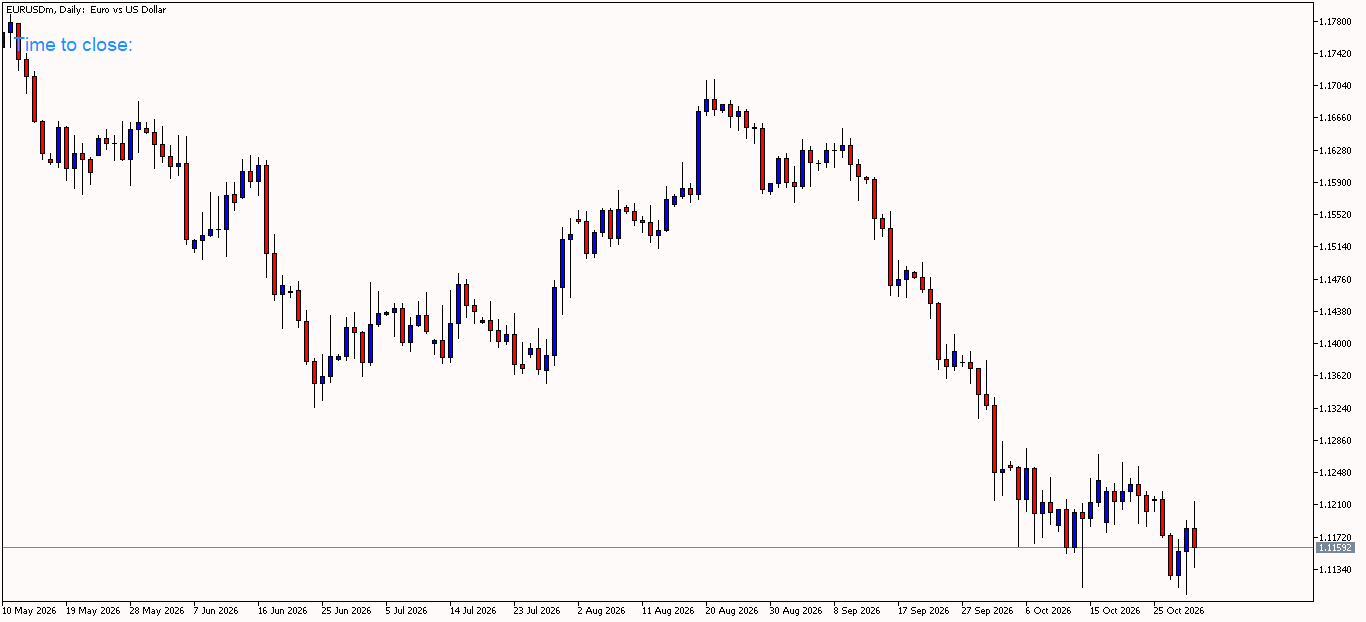
- The trend is down. The pair has fallen from about 1.17 in August to about 1.11. October was a second red month in a row on the monthly chart.
- It is on a shelf. The area just above 1.1100 has been tested twice in October and held. The top of the recent range is about 1.127.
- It is a pause, not a bottom. Two weeks of sideways trading near the lows after a long fall is a pause. Nothing on the chart says the fall is over.
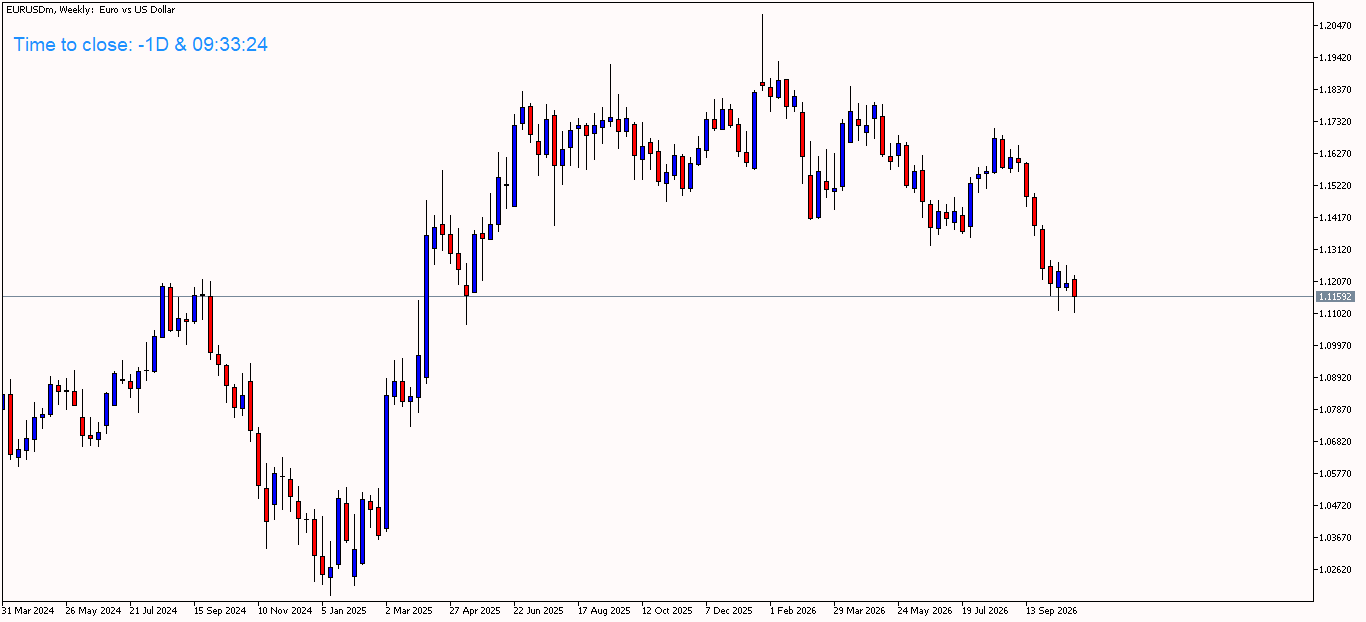
If the dollar index breaks above its ceiling, EURUSD would likely test 1.1100. A clean close below it opens the way to the next big area, around 1.10 on the monthly chart. If EURUSD holds 1.11 and rallies above about 1.127, it would be a warning that the dollar’s breakout is failing.
GBPUSD: bounced, then rejected, and no trend
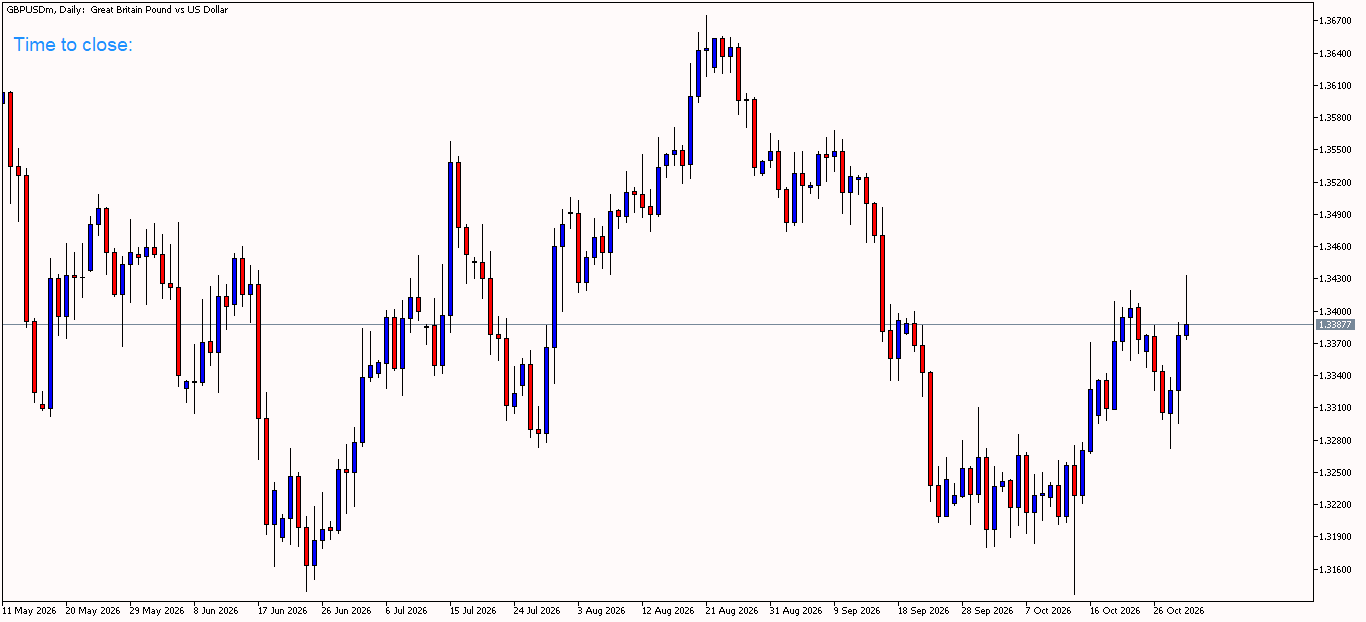
- It bounced while EURUSD fell. That is the opposite of what a stronger dollar would do.
- It was rejected at 1.34. Friday’s upper wick to about 1.3435 means sellers showed up at the top.
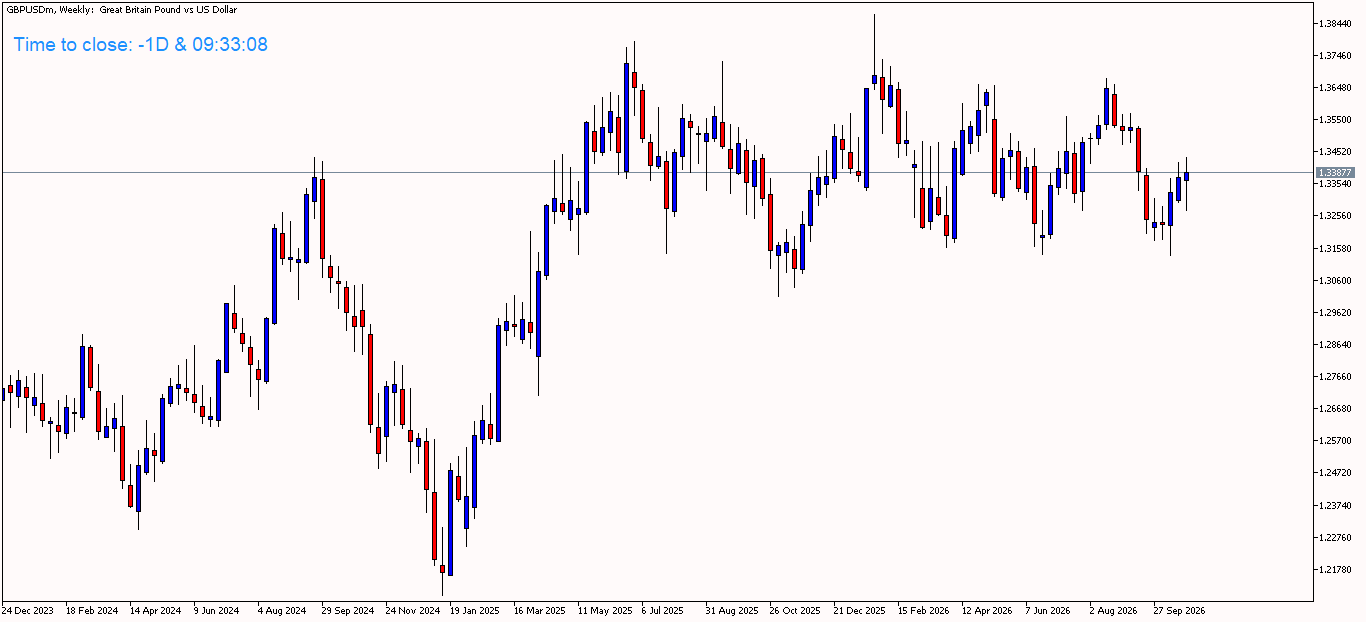
- The big picture is sideways. On the weekly chart, GBPUSD has been inside a wide range of about 1.31 to 1.385 since the middle of 2025, and it is sitting in the middle of it.
The agreement check
This is our rule: the dollar index, EURUSD and GBPUSD must point the same way before we consider a dollar trade. When they disagree, one of the pairs is being driven by something else, such as a UK-specific story, and the dollar signal is muddy.
| Chart | What it shows | Agrees with a stronger dollar? |
|---|---|---|
| DXY | Bullish score +5, but price is inside a range | Bias yes, breakout not yet |
| EURUSD | Clear downtrend, sitting on 1.11 support | Yes |
| GBPUSD | Bounce, rejected at 1.3435, sideways range | No |
The result: it fails for now. EURUSD agrees, GBPUSD does not, and the dollar index has not broken out. Under our rule, we stay out of GBPUSD. EURUSD is the only pair with chart support for dollar strength, but it is sitting right on support, so selling into it is risky. The better situation is to wait for the dollar index to close above 102.5 and for EURUSD to break below 1.1100 with GBPUSD following. That would be a real agreement.
What could change things this week
- Friday, November 6: the US jobs report. This is the big event. Last month’s report was weak (29,000 jobs against 84,000 expected), and it already counts against the dollar in our score. Another weak report could pull the dollar index to its floor. A strong one would support the hike case for December.
- December hike odds. CME FedWatch has the December 8–9 hike at 80.3%. If this number falls below 30%, our score loses a point.
- Next week: US inflation (CPI) on November 10 and producer prices (PPI) on November 13.
- Other news. Always check the economic calendar for other releases and central bank speakers, because they can move prices at any time.
A safe plan for beginners
- Do not trade the open. Weekend gaps and wide spreads can trap you in the first minutes.
- Wait for a daily close above 102.5 or below 101.45 on the dollar index before treating it as a breakout.
- Run the agreement check first. If the three charts do not agree, stay out.
- Keep your size small and use a stop loss. Our notional value guide shows how to size a trade.
The risks
- Ranges end suddenly. A single news release can break the floor or the ceiling and skip past your stop loss.
- The levels in this post are read from the charts and are approximate.
- A bullish score does not guarantee the dollar will rise. We explained this in our post on bullish bias with falling price.
- Trading forex and CFDs carries a high risk of loss. This is education, not a trade recommendation or financial advice.
Where the numbers come from
The charts are daily, weekly and monthly charts of DXY, EURUSD and GBPUSD from our own platform, captured on November 1, 2026. The DXY Bias Score, CME odds and jobs figures come from our Macro Tracker. For how the score got to +5, read this post, and for how yields connect to the dollar, see our yields guide.