If you trade forex or CFDs, you will hear people say “watch the yields.” Most beginners nod and move on, because nobody explains what a yield is or why a bond has anything to do with EURUSD. The short answer: bond yields tell you where big money wants to go, and big money moving in or out of the dollar is what moves the dollar. This post explains it with simple examples and no jargon.
First: what is a bond, and what is a yield?
A bond is a loan. When you buy a US government bond, you lend money to the US government. The government promises to pay you back on a set date, and to pay you interest while you wait.
The yield is the interest you earn, shown as a yearly percentage. If a bond has a yield of 5%, you earn about $5 a year for every $100 you lend. A “2-year” bond is a loan for two years. A “10-year” bond is a loan for ten years.
That is all a yield is: the interest rate you are paid for lending to the US government.
Why would interest on a bond move the dollar?
Think about two banks. One pays 2% on savings and the other pays 5%. Where would you keep your money? The 5% bank, of course. Big investors think the same way, with billions of dollars.
Now picture it for countries. If the US pays more interest than Europe, investors want to put money in US bonds. But to buy US bonds they first need US dollars, so they buy dollars. When many people buy dollars, the dollar goes up. If US interest falls compared with other countries, that pull gets weaker and the dollar usually softens.
That is the whole idea: money follows interest, and interest moves the dollar.
2-year vs 10-year: what is the difference?
Both are loans to the same government. The difference is the time, and that changes what each one tells you.
| 2-year yield | 10-year yield | |
|---|---|---|
| Think of it as | The Fed’s mood for the next year or two | The mood about the economy for the next ten years |
| What mostly moves it | What traders expect the Fed to do with interest rates | The Fed, but also worries about growth, long-term inflation and government borrowing |
| How fast it reacts | Very fast to Fed news, CPI, PPI and jobs data | Reacts to those too, but also to fear and big shifts in stocks |
| How clean a signal for the dollar | Cleaner, because it is close to the Fed | Noisier, because more things move it |
A simple way to remember it: the 2-year asks “what will the Fed do?” and the 10-year asks “how is the whole economy doing?”
A real example from last week
Last week gave a perfect lesson. Here are the weekly numbers from our charts:
| Market | Weekly close | Change on the week |
|---|---|---|
| US 2-year yield | 4.686% | −0.62% |
| US 10-year yield | 4.999% | −1.61% |
| Dollar index (DXY) | 101.751 | −0.03% (almost flat) |
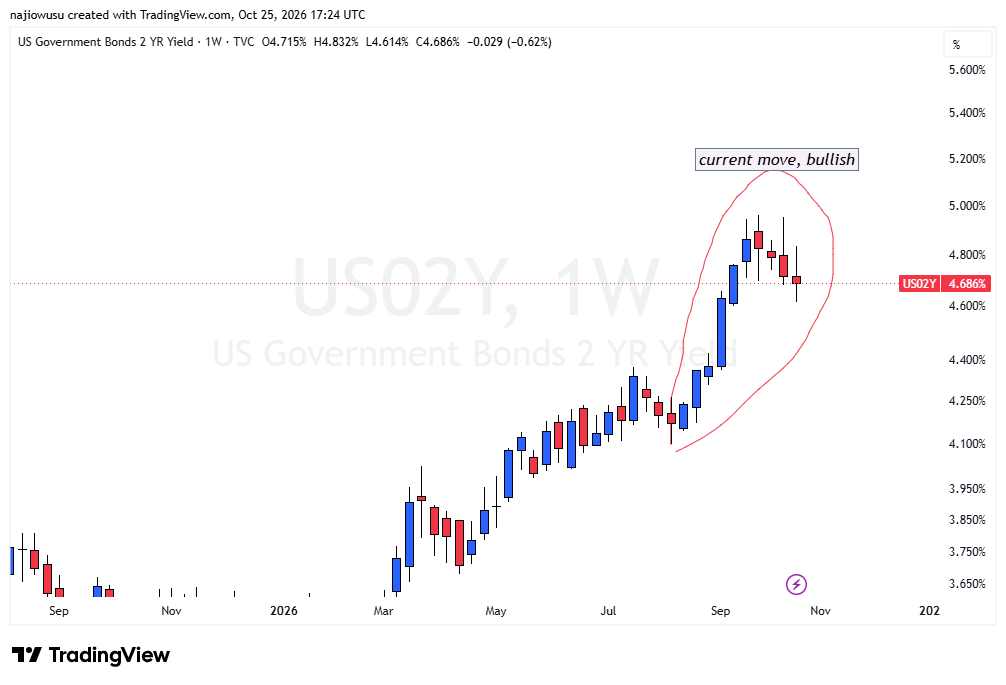
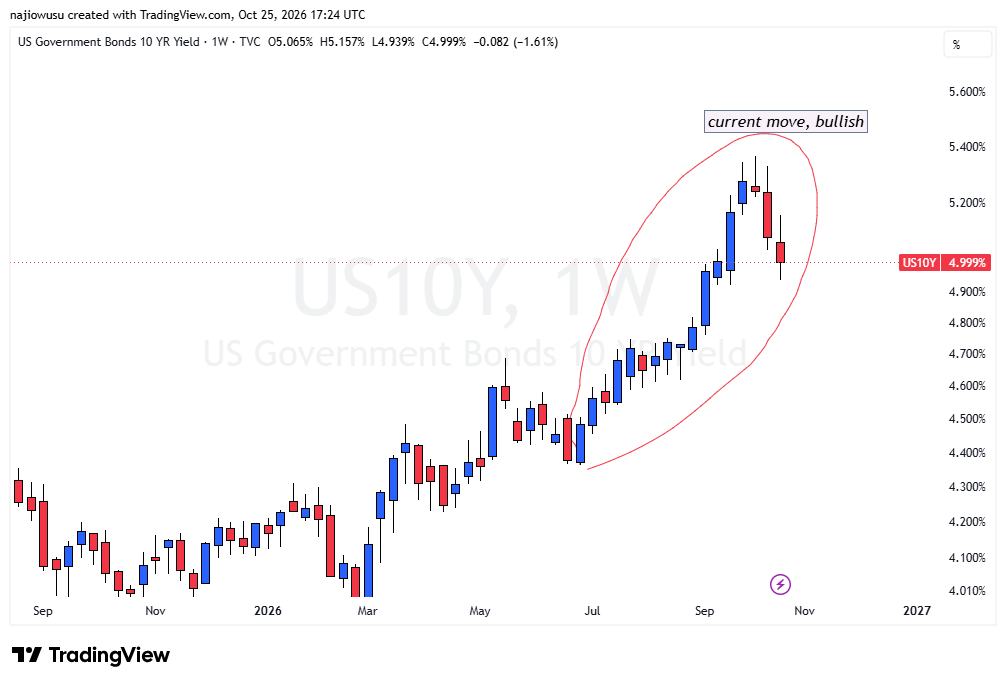
The 10-year yield fell by more than twice as much as the 2-year. Reports said the 10-year fell because of worries about growth and credit, a fall in technology shares and weak jobs data. Those are “how is the economy doing?” reasons, not “what will the Fed do?” reasons. The 2-year barely moved because traders still expected the Fed to raise rates again in December. And the dollar index barely moved either.
The lesson: the 2-year was telling the truer story about the dollar. The 10-year was mostly telling a story about worry.
From the dollar to the other currencies
You do not need a separate view for every currency. Most of the big pairs are priced in dollars, so once you know which way the dollar is leaning, you know the likely lean for the rest.
- EURUSD and GBPUSD. These show how many dollars one euro or one pound costs. When the dollar gets stronger, each euro and pound buys fewer dollars, so the pair falls. When the dollar gets weaker, the pair rises.
- USDJPY. This is the other way round: how many yen one dollar buys. A stronger dollar usually makes the pair rise.
- The dollar index (DXY). This is the dollar against a basket of the main currencies, so it is the quickest single view of dollar strength.
- Gold. Gold is priced in dollars too and often moves the opposite way to the dollar and to yields. But it does not always follow, as last week showed, so do not treat gold as a copy of the dollar.
Four simple pictures
| What the yields are doing | What it usually means | Likely effect on the dollar |
|---|---|---|
| Both rising | Traders expect a tougher Fed or hotter inflation | Dollar supported |
| 2-year rising, 10-year flat | The Fed is expected to hike, but the longer view is cautious | Dollar usually still supported |
| Both falling | Traders expect a softer Fed | Dollar under pressure |
| 10-year falling, 2-year steady (last week) | Worry about the economy, but the Fed is still expected to act | Mixed. The dollar often just pauses |
One more thing: the other country’s yield matters too
The dollar does not move on US yields alone. Remember the two banks: what matters is the difference in interest. If US yields rise but UK yields rise just as much, there is no extra reason to buy dollars, and GBPUSD may not fall. That is one reason a pair sometimes refuses to follow the dollar index.
How this fits with the DXY Bias Score
Our DXY Bias Score counts the news that matters for the dollar: what the Fed did, what inflation and jobs reports showed, what traders expect from the Fed, and how big players are positioned. That news is the reason. The yields are the market’s reaction. You want both, and you want them to agree.
| What you see | What it means |
|---|---|
| Score bullish and the 2-year yield rising | The reason and the market agree. This is the cleanest picture for a stronger dollar. |
| Score bullish but the 2-year yield falling | The market is doubting the story. Find out why before you trust the score. |
| Score and yields agree, but DXY, EURUSD and GBPUSD do not | That is a correlation break. Our method is to stay out until they line up. |
Right now the score is +6, Bullish DXY, the 2-year yield is in a long up-move that has paused, and the dollar index is pausing too. They agree, and everyone is waiting for the Fed on Wednesday, October 28. For how the weekly and daily charts fit together, read Bullish Bias, Falling Price. For all six charts before the Fed, read our weekly charts post.
A simple routine for beginners
- Check the DXY Bias Score. Is the reason for the dollar bullish, bearish or neutral?
- Look at the 2-year yield. Is it rising, flat or falling on the weekly and daily chart? Does it agree with the score?
- Look at the 10-year yield. Does it agree with the 2-year? If not, be careful, because it may be about worry and not the Fed.
- Look at the dollar index. Is the dollar moving the way the yields say?
- Check EURUSD and GBPUSD. Do they agree with the dollar index? If one disagrees, stay out of that pair.
- Only then look for an entry on your own chart, and use a stop loss.
Common beginner mistakes
- Treating yields as a signal on their own. They are one input, next to the score and the charts.
- Trading the first minutes after big news. Yields can jump and come back within minutes. Wait for closes.
- Forgetting the other country. The dollar is half of every pair.
- Assuming it works every week. Last week gold fell while yields fell. Relationships bend, so confirm with price.
The risks
- Yields can change direction fast, especially around the Fed (October 28), PCE (October 29) and the jobs report (November 6).
- Trading forex and CFDs carries a high risk of loss. Use a stop loss and risk only a small part of your account on any trade.
- This is education, not a trade recommendation or financial advice.
Where the numbers come from
The weekly yield and dollar index figures are from our own TradingView weekly charts (captured October 25). The reasons given for last week’s fall in the 10-year yield come from market reports we cite in our weekly charts post. Our tracker figures are on the Macro Tracker. For a closer look at why yields fell after the hot inflation reports, see our yields guide.