The Fed decides on Wednesday, October 28. Before it does, we put six weekly charts side by side: the 10-year and 2-year bond yields, gold, EURUSD, the dollar index (DXY) and GBPUSD. The short answer: gold broke below $4,000 and is the one big mover, bond yields cooled but are still in an up-move, the dollar paused, and GBPUSD is the only pair that does not agree with the rest. A weekly chart shows one candle per week, so it filters out the daily noise and shows where the bigger move stands going into a big event.
The six markets in one table
The numbers below are the weekly closes from our TradingView charts. The change is against the previous week’s close. The last column is our read of the bigger move, as marked on each chart.
| Market | Weekly close | Change on the week | Current move (our markup) |
|---|---|---|---|
| US 10-year yield | 4.999% | −0.082 (−1.61%) | Bullish, pausing |
| US 2-year yield | 4.686% | −0.029 (−0.62%) | Bullish, pausing |
| Gold (XAUUSD) | $3,994.00 | −174.30 (−4.18%) | Bearish |
| EURUSD | 1.12031 | −0.00358 (−0.32%) | Bearish |
| Dollar index (DXY) | 101.751 | −0.028 (−0.03%) | Bullish, pausing |
| GBPUSD | 1.33708 | +0.00492 (+0.37%) | Bullish |
Read it like this: yields and the dollar are in up-moves that have stopped for a breath, EURUSD and gold are in down-moves, and GBPUSD is bouncing. Most of this fits a dollar that is strong but resting. One piece does not fit, and we come back to it below.
1. The 10-year yield: still up, but under 5% for now
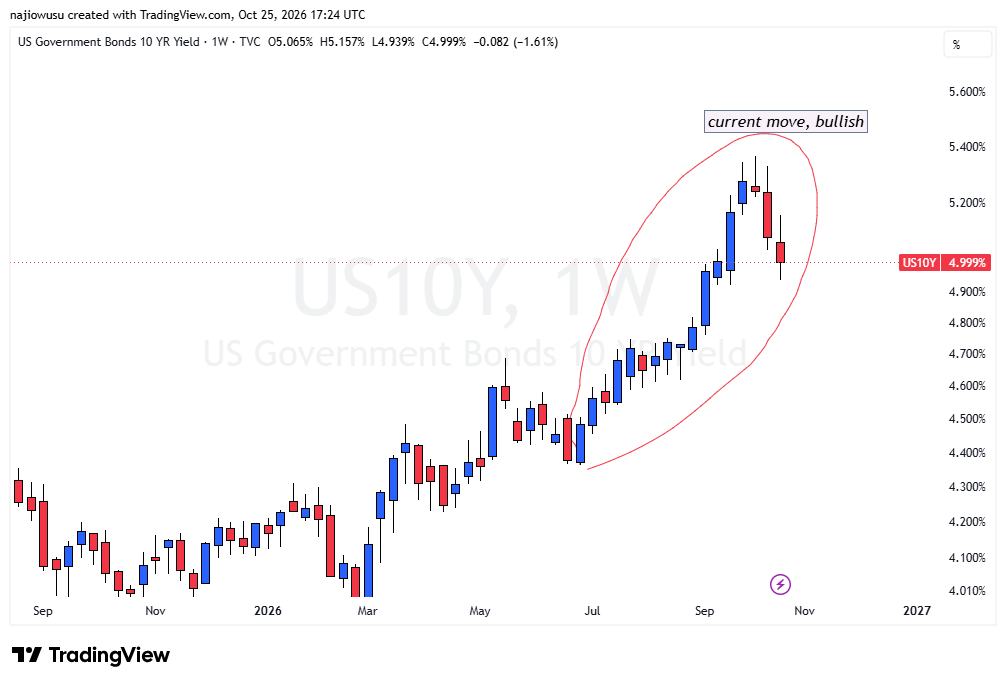
The move since June is a big, steady climb, and two red candles so far are a small step back in comparison. The yield closed a hair under the round 5% mark. Reports said the fall came from worries about growth and credit, a sell-off in technology shares and the weak September jobs report, not from inflation easing. That matters, because it means the pullback can end quickly if the Fed sounds firm.
What to watch: a weekly close back above this week’s high (5.157%) would say the pullback is over. A weekly close under this week’s low (4.939%) would say the pullback is turning into something bigger.
2. The 2-year yield: the Fed’s own market
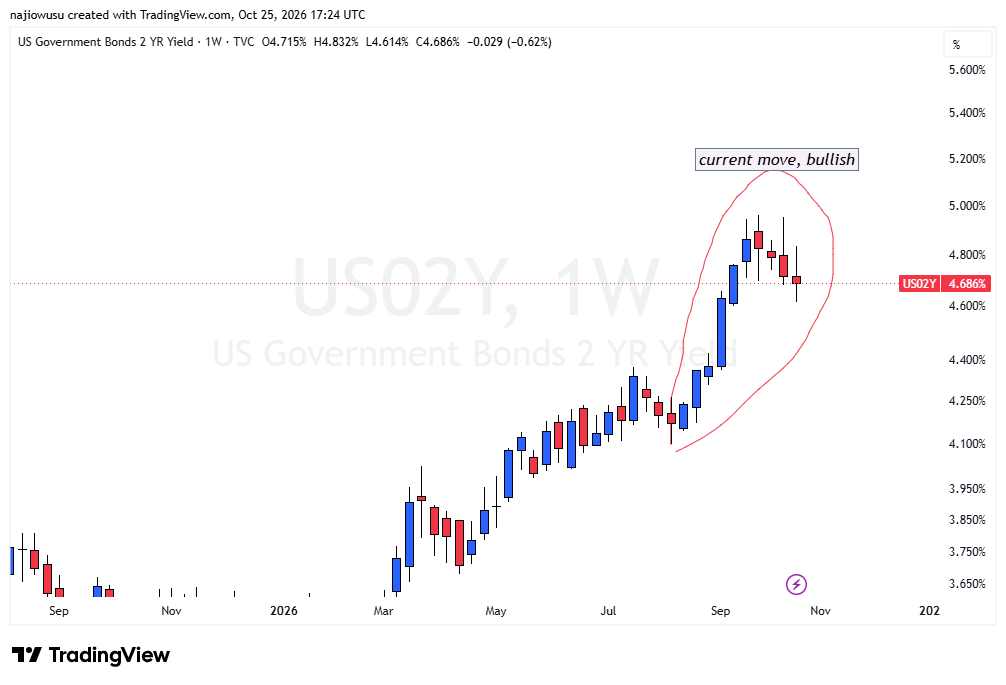
The 2-year yield follows what traders think the Fed will do over the next couple of years, so it is the cleaner read on the Fed itself. It has fallen less than the 10-year (0.62% against 1.61% this week), which says traders still expect the Fed to raise rates again. That matches the pricing for a hike in December. If the Fed sounds relaxed on Wednesday, this is the chart that should show it first.
3. Gold: the big mover, and it broke the rules this week
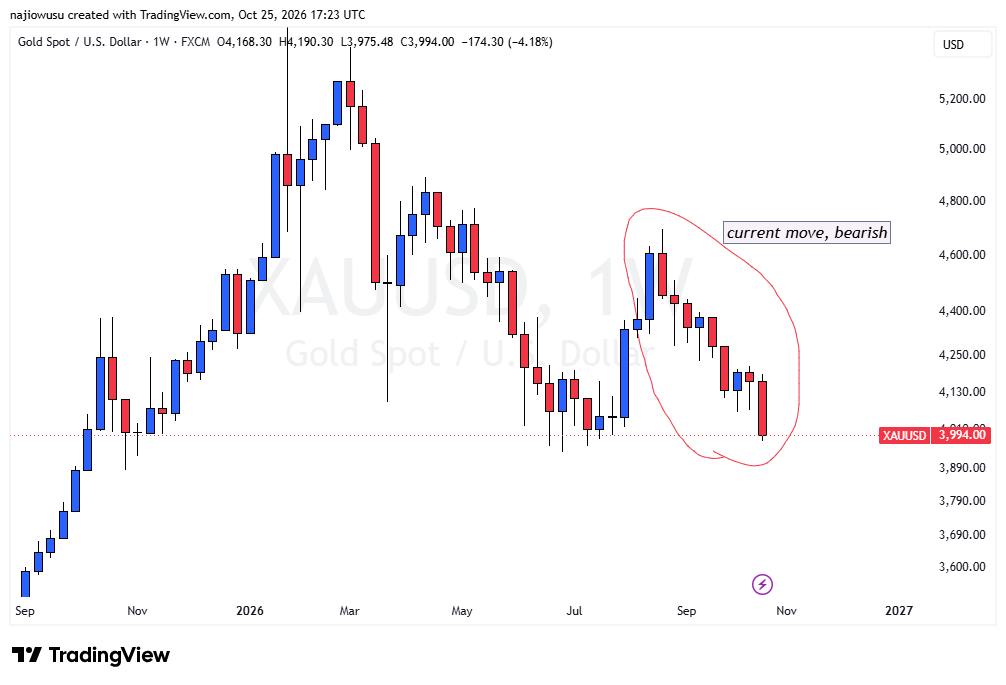
Gold had its biggest weekly drop in months and closed right on the summer lows. In our October 21 post we marked a box between $4,067 and $4,217 on the daily chart. Both the $4,067.04 floor and the round $4,000 gave way this week.
Here is the part to be honest about. In that post we said gold follows bond yields and the dollar. This week it did not: yields fell, the dollar was flat, and gold still dropped. Reports gave two reasons. Oil jumped (Brent was reported near $117 on Friday) after Houthi attacks on Saudi energy sites, and a sell-off in technology shares led some funds to sell gold to raise cash. When investors are forced to sell what they can sell, even a safe-haven falls. That is a different kind of move from the yield story, so the usual link can fail for a while.
What to watch: analysts quoted by news sites put resistance near $4,075 and support near $3,963 and $3,946, with $3,890 as a downside target. These are analysts’ levels, not ours. On our own chart the first question is simple: can gold close a week back above $4,000, or does it close below it again? The summer lows around $3,960 to $4,000 are where buyers stepped in before.
4. EURUSD: selling has slowed, not reversed
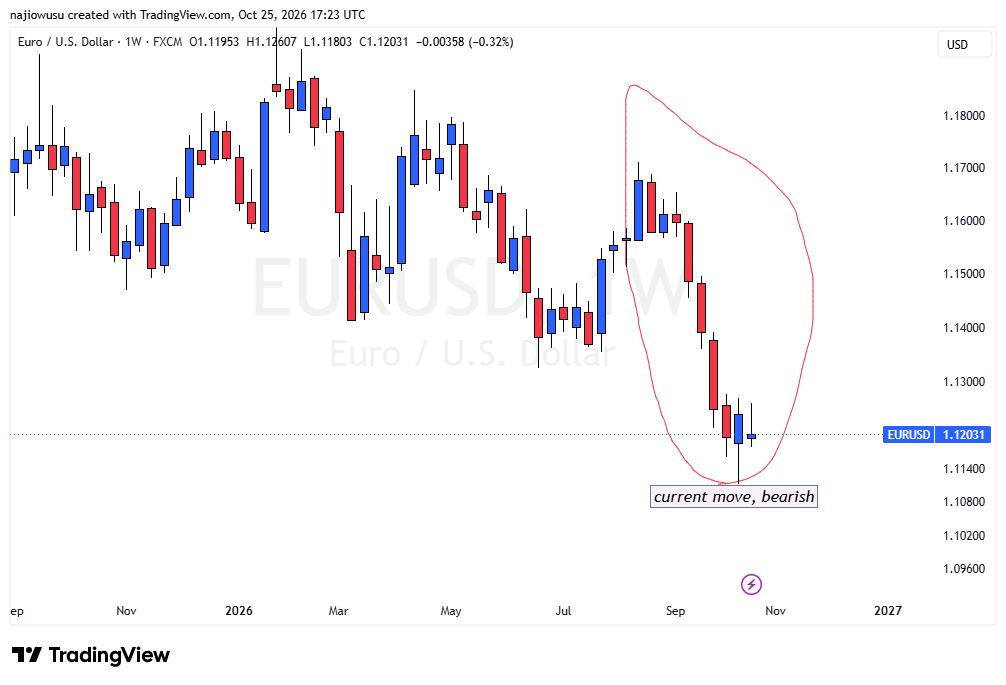
EURUSD is in a down-move, which is the same thing as the dollar being strong against the euro. But the last three weekly candles are small and sit just above the low from two weeks ago (near 1.111). That looks like a market waiting for the Fed, not one that is still selling hard.
What to watch: a weekly close below that low near 1.111 would say the down-move is back. A weekly close above this week’s high of 1.12607 would be the first sign of a bounce.
5. The dollar index: a pause inside a bigger up-move
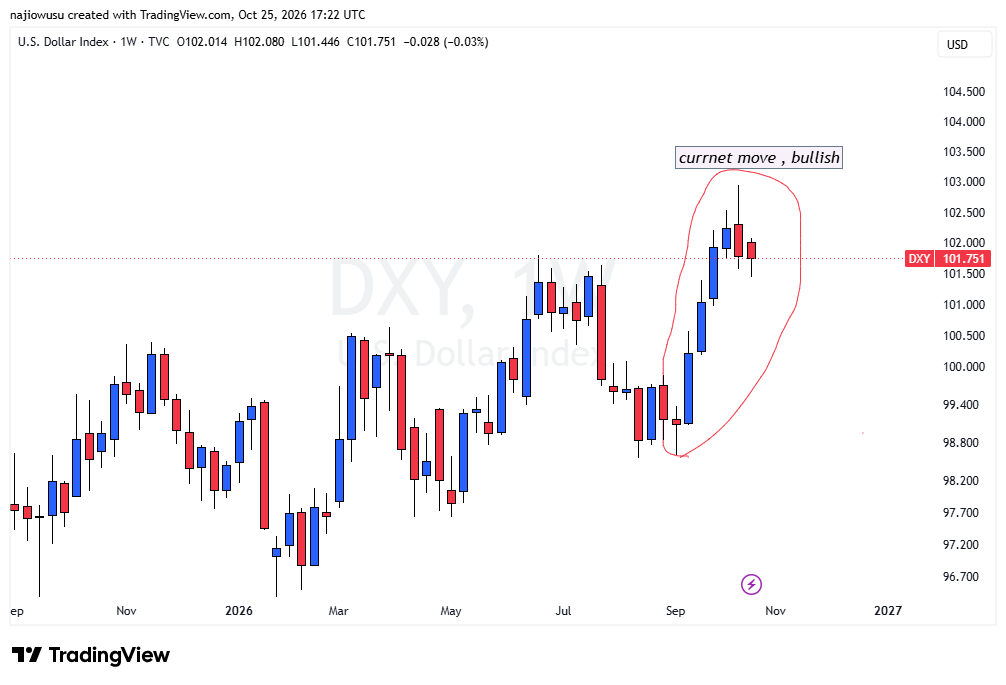
DXY has been rising since late summer, and the last two weeks are small pullbacks, not a reversal. It barely moved this week even though yields fell, which says the dollar is being held up by the same thing as the 2-year yield: the expectation of another Fed hike. Our DXY Bias Score is +6, Bullish DXY, which agrees with this chart. This is the idea from our guide Bullish Bias, Falling Price: the weekly chart can stay bullish while the daily chart pulls back.
What to watch: a weekly close above 102.080 would end the pause. A weekly close below this week’s low of 101.446 would be the first real crack in the up-move.
6. GBPUSD: the one that does not agree
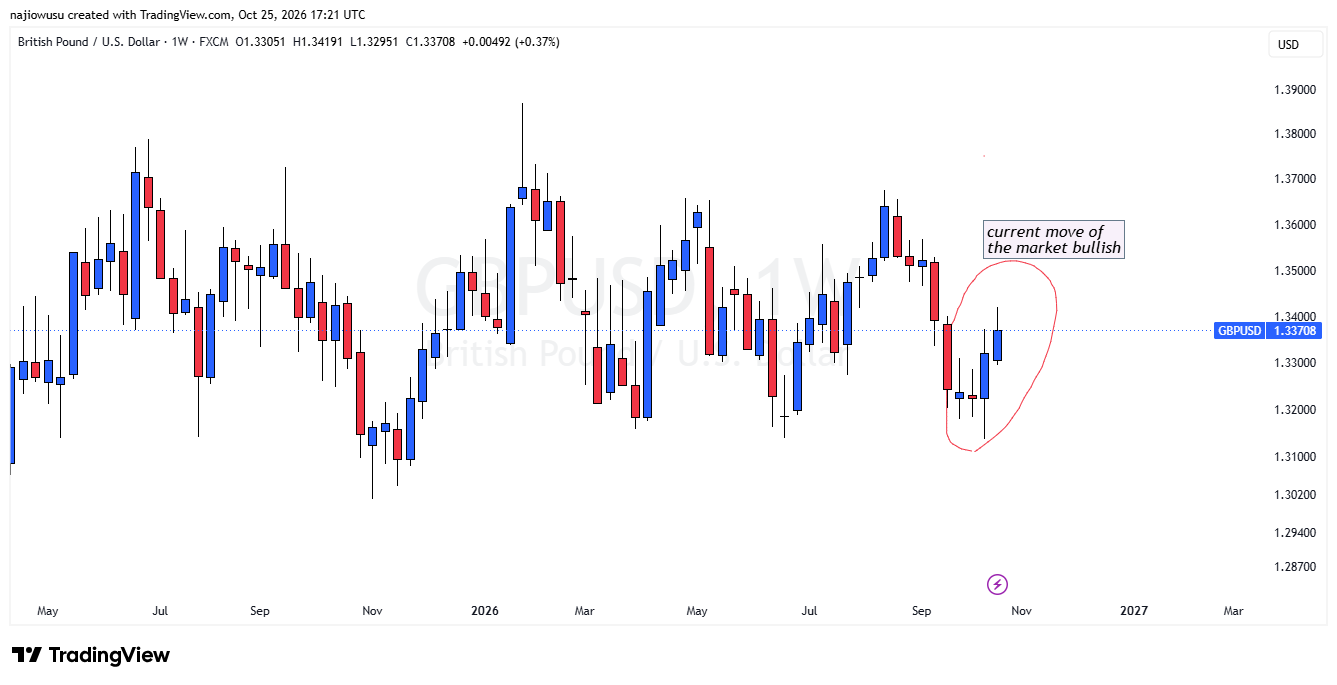
If the dollar is strong, GBPUSD should be weak, like EURUSD. Instead GBPUSD has bounced for two weeks while DXY was flat and EURUSD was flat to lower. That is a correlation break. Our method needs the dollar index, EURUSD and GBPUSD to tell the same story before we look for a trade. Right now they do not, so the plain-English answer is to stay out of GBPUSD until they line up, in whichever direction.
What to watch: if GBPUSD fails near this week’s high of 1.34191 after the Fed, it joins the other two. If it breaks above it while the dollar index rises, something else is going on and you should be careful.
What the Fed could do on Wednesday
The Fed meets on October 27–28. The decision comes on Wednesday at 2:00 pm New York time, followed by Chair Warsh’s press conference. There are no new Fed projections this time. CME FedWatch priced about a 90% chance of a hold at 3.75–4.00% on Friday, and a Reuters poll of 100 economists found 94 expecting no change. All 100 expected a hike by December. A hike on Wednesday is priced at only about 10%.
| If the Fed… | What it would likely mean | What to look for on the charts |
|---|---|---|
| Holds and points to a December hike | Yields and the dollar probably firm up. This is the case our +6 score already leans toward. | DXY above 102.080, EURUSD back toward its low near 1.111, GBPUSD bounce at risk. |
| Holds and sounds relaxed about December | December hike bets would shrink. Yields and the dollar could dip. | DXY below 101.446, EURUSD above 1.12607, GBPUSD pushing above 1.34191. |
| Hikes (about 10% priced) | A surprise. The first move would probably be a fast jump in yields and the dollar. | Expect big, fast candles. Wait for the dust to settle. |
Gold is the hard one. The usual story says a firm Fed is bad for gold. But gold is already at the summer lows, and this week it fell for reasons that had little to do with yields. Do not assume it will react by the old rules.
What else is coming
- PCE inflation and third-quarter GDP, Thursday October 29. They come the day after the Fed.
- The US jobs report, November 6 and CPI, November 10.
- Oil and the Gulf. Brent near $117 is feeding inflation worries. Headlines about the Gulf can move oil, yields and gold within minutes.
What a trader could look for
This is education, not a trade recommendation.
- Do not trade the first minutes after the Fed. The statement at 2:00 pm and the press conference can pull price in both directions. Wait for daily closes, not spikes.
- Check that DXY, EURUSD and GBPUSD agree. Today they do not, because of GBPUSD. If they line up after the Fed, the setups become cleaner.
- Use the weekly levels as the big picture and the daily chart for entries. The weekly highs and lows above are the lines that would change the story.
- Size your trade first. Gold moved $174 this week. Our notional value guide shows how to work out what a move like that means for your account.
The risks
- A weekly chart is slow. A big surprise on Wednesday can change a weekly picture in one day.
- The yield and gold explanations come from news reports, and the oil headlines (attacks on Saudi energy sites) were not all confirmed by Saudi Arabia at the time.
- Prices differ a little between feeds and brokers. The numbers in this post are from our TradingView charts. Use your own broker’s chart.
- Use a stop loss and risk only a small part of your account on any trade. Not financial advice.
Where the numbers come from
Weekly closes, ranges and levels marked as ours are from our own TradingView weekly charts (captured October 25). Gold’s weekly drivers, the Brent price and the Fed odds on Friday come from FinanceFeeds (citing Kitco, Reuters, FXStreet and Trading Economics), including the analysts’ levels. The reasons yields fell and the stock-market moves come from HDFCSky. The Reuters poll of economists comes from Mitrade. Our tracker figures are on the Macro Tracker. We will go through the Fed decision in the next post.